


Game of Homes


 Rapid recovery from the Great Recession, buoyed by the shale oil boom, has fueled demand for single-family homes in Texas. Homebuilders have been unable to keep pace with increasing demand; supply is limited by lot and labor constraints, reducing affordability.
Prices Ascend to New Highs
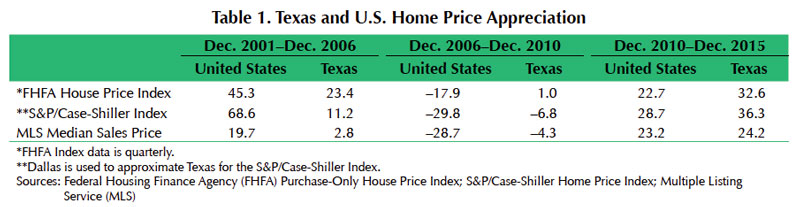
Texas has a vast supply of land suitable for development and relatively few building regulations. Construction typically responds quickly to demand, resulting in smaller home price swings versus other large states. During the U.S. housing boom in the mid-2000s, Texas recorded modest home price appreciation, while prices nationwide climbed to record levels (Table 1). Similarly, when the housing market peaked and home values collapsed across the U.S., price declines in Texas were muted.
During the housing recovery, Texas price gains uncharacteristically outpaced those at the national level from December 2010 to December 2015, pushing home prices to record highs. Prices rose 33 percent in second quarter 2016 from fourth quarter 2007—the high before the housing bust, according to Federal Housing Finance Agency (FHFA) data. In contrast, U.S. home prices surpassed their prerecession peak in fourth quarter 2015 and are only 2.8 percent above their previous high.
Other measures, such as the Standard & Poor’s/Case-Shiller Index and data from the Multiple Listing Service, show a similar pattern of less Texas home price volatility during the U.S. housing boom-bust period but an unusual surge in values recently (Table 1).
Driven by Population, Economic Growth
Texas has been a leading state for domestic migration since the mid-2000s, only losing the top spot to Florida in 2015 (Figure 1). California is by far the leading “sending” state as companies have increasingly departed for Texas. This influx of people isn’t limited to domestic transfers; Texas has been consistently among the top five states for international migration.
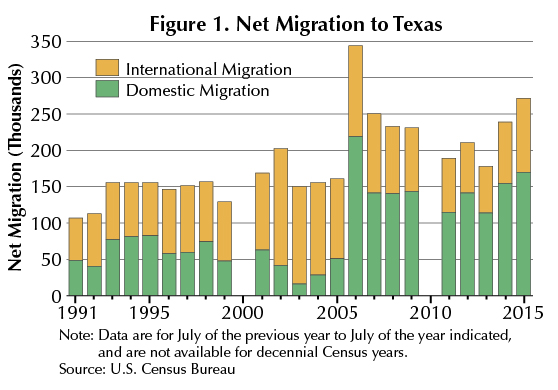
This mass migration to Texas has propelled strong population growth. According to the U.S. Census Bureau, the state’s population has grown almost a full percentage point faster than the U.S. since 2010. Texas’ relatively low cost of living, strong economic growth due to the most recent oil boom, and lightly regulated commercial environment have attracted businesses and people to the state. Naturally, this has increased demand for housing, particularly in the major metros. While the number of households in Texas grew 1.5 percent on average annually from 2011 through 2015, the number of housing units (including apartments) increased 1.2 percent, drawing down existing-home inventories to record lows.
The fast recovery from the Great Recession catapulted the Texas economy to breakneck job growth from 2012 through 2014, pushing demand for housing even higher. Existing-home sales began climbing in mid-2010. This picture is even more pronounced when home sales are divided into price ranges.
Growth in sales of homes priced $300,000–$399,000 took off in early 2012 (Figure 2). At lower price points, sales have been constrained by the tightening supply. Inventory of homes below $200,000 has fallen to historically low levels of about 2.6 months (around 6.5 months of inventory is considered balanced). Inventory levels for these entry-level homes are even tighter at the metropolitan statistical area (MSA) level, coming in at around two months for Houston and San Antonio and about one month in Austin and DFW.
Given tight inventories, home sales in Texas’ major metros have been flat or declining in the under-$200,000 price range, while growing rapidly at higher price points. This trend is most evident in Austin, which has experienced a noticeable drop in sales of homes priced below $200,000 since 2011. The DFW and Houston areas have reported similar trends. San Antonio has fared a bit better.

Falling Housing Affordability
With greater available inventory at the higher price points, sales growth at the higher end of the market has taken off. This has shifted the composition of homes sold. In 2011, 68 percent of homes sold in Texas were under $200,000; by 2016, they represented only 48 percent of the market. The distribution of homes sold in each price range by metro so far in 2016 is shown in Table 2, compared with the same period in 2011. The largest shift is seen in the lowest price range, falling in major metros by 21 to 33 percentage points. Noticeable increases are seen in both the $200,000–299,000 and $300,000–399,000 price ranges. DFW and Houston have similar distributions, while Austin is skewed higher and San Antonio lower.

This low-inventory, high-demand market has contributed to median home prices rising faster than incomes. From 2011 through 2015, Texas household income rose at an average annual rate of 3.6 percent, while the median sales price of existing homes increased by more than twice that—7.3 percent per year on average.
As a result, Texas housing is less affordable, particularly in certain metros. Dallas had the steepest declines in affordability from first quarter 2011 through second quarter 2016, dropping 17.9 percentage points to 50.9 percent of homes sold during the quarter considered affordable to median-income families. Austin was a close second, falling 17.5 percentage points with 56.3 percent of homes viewed as affordable in second quarter 2016, followed by Houston, which experienced an 11.7 point decline to 60.6 percent. Fort Worth saw a drop of 15.0 points, but remains the most affordable among the large metros, at 66 percent. San Antonio has experienced the smallest decline in affordability since 2011.
Lot Supply Tight, Pricing Escalates
Single-family permits in Texas remain below highs recorded during the U.S. housing boom. Despite strong demand for single-family homes since the end of 2011, building has been limited by availability of lots, labor shortages, increased local government-imposed impact fees, lot costs from regulatory processes, and tight credit for land development.
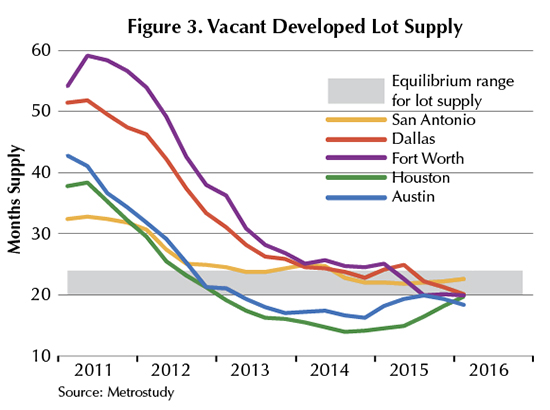
Initially during the housing recovery, vacant developed lots for building were plentiful. Supply dwindled in most major metros as delays in land permitting and shortages of skilled construction workers extended lot delivery times. Available vacant developed lots fell consistently from 2011 through 2013 in Texas’ major metros (Figure 3).Total lot supply appears to have stabilized and in first quarter 2016 stood at around 20 months or higher in most Texas major metros, signaling a nearly normal market. Austin is the exception, with supply remaining somewhat tight at 18 months.
The decline in lots available for building has been particularly evident in the under $200,000 price range, where supplies have depleted faster, ranging from eight months in Austin to 23 months in Dallas in the first quarter. Lot supply for housing at this price point is tight as higher land, labor, and material costs have pushed developers and builders to shift from entry-level to higher-priced homes.
In Fort Worth, the share of vacant developed lot inventory for homes priced under $200,000 dropped by two-thirds from second quarter 2011 through second quarter 2016 (Table 3). Significantly larger declines occurred in other major metros over the period. In contrast, the share of vacant developed lots has climbed for homes priced over $300,000 in all major metros—more than doubling in Dallas and Houston.

Data from the National Association of Home Builders (NAHB) construction cost survey show that the average lot cost per square foot in 2015 was $4.20, higher than $3.30 per square foot in 2011—an increase of 27.3 percent. Although land remains expensive, prices have come down, and in 2015 were below their 2013 peak of $5.20 per square foot.
Tight Credit
The Federal Reserve’s senior loan officer opinion survey indicates that from 2008 to 2010, a higher share of respondents nationwide were tightening credit standards for commercial real estate lending, which includes construction and land development loans. The trend began reversing in 2011, with a pickup among those reporting loosening credit requirements for these loans.
More recently, in third quarter 2016, the survey suggests that on net, financing was becoming more challenging for construction and land development loans, although credit standards for these types of loans were reported unchanged at most participating banks.
Labor Short, Costs Rise
Growth in Texas residential construction employment has been slow, despite strong statewide job gains. While it took Texas about three and a half years to regain jobs lost during the Great Recession, payrolls in residential construction in March 2016 remain slightly below their pre-recession high of 50,550 workers. This slow labor recovery was partly due to the shale oil boom, which created nonresidential construction jobs such as downstream energy plants and offices.
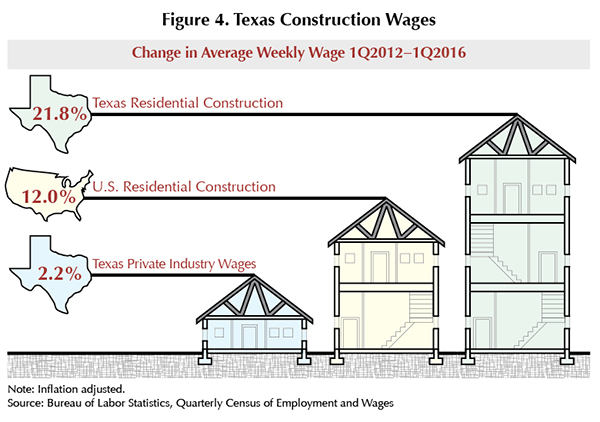
Strong demand for single-family homes combined with a tight construction labor market has resulted in stronger wage growth in residential construction in Texas versus the nation. Inflation-adjusted average weekly wages in residential construction climbed 21.8 percent from first quarter 2012 through first quarter 2016. This compares with 12.0 percent for residential construction wages in the U.S. and overall 2.2 percent growth in Texas total private industry wages (Figure 4).
Outlook
Entry-level homes constitute a smaller share of the market today than they did when the housing recovery began following the Great Recession—a result of unprecedented home price appreciation in Texas.
Low interest rates have helped support growth in sales of higher-priced homes, but an increase in mortgage rates will further pressure affordability. Among the major metros, Fort Worth appears to be better positioned to supply new homes at the entry level due to its higher share of vacant developed lot inventory suitable for the under-$200,000 home price range (Table 3). By comparison, Austin and Dallas have the lowest share of vacant developed lot inventory needed to build similarly priced homes.
____________________
Assanie ([email protected]) is a business economist and Greer ([email protected]) is a research analyst at the Federal Reserve Bank of Dallas, and Dr. Torres ([email protected]) is a research economist with the Real Estate Center at Texas A&M University. The views expressed in this article are strictly those of the authors and do not reflect the positions of the Federal Reserve Bank of Dallas or the Federal Reserve System.
References
Assanie, Laila. “Single-Family Housing Squeeze Eases in Texas, Multifamily Soars,” Southwest Economy, Federal Reserve Bank of Dallas, Fourth Quarter 2014.
Hedberg, William; Krainer, John. “Why Are Housing Inventories Low,” FRBSF Economic Letter, Federal Reserve Bank of San Francisco, 2013-31, October 21, 2013.
Eyingungor, Burcu. “Housing’s Role in the Slow Recovery,” Economic Insights, Federal Reserve Bank
of Philadelphia, Second Quarter 2016.
Rappaport, Jordan. “The Limited Supply of Homes,” The Macro Bulletin, Federal Reserve Bank of Kansas City, March 23, 2016.
You might also like

TG Magazine
Check out the latest issue of our flagship publication.