


Change and Challenges

 The rapidly rising price of single-family homes in East Austin has left homeownership out of reach for its existing low-income population. From 2011 to 2015, growth rates of home sales prices in East Austin were two to four times that of Travis County and the Austin-Round Rock MSA.
While rooted in single-family housing, lack of affordability is also deepening in East Austin’s apartment sector. The widening divide between housing costs and household income has spelled disaster for East Austin’s affordability and forced many of its residents to relocate farther from downtown.
The effect of explosive job and population growth on East Austin’s single-family housing market was outlined in "East Side Story" (Center publication 2139). This article delves deeper into the area’s overall housing affordability challenges and how they will impact East Austin’s demographics, issues that more and more Texas cities will face.
East Austin’s Changing Demographic Dynamics
East Austin has historically housed minority populations. A city plan published in 1928 segregated Austin’s Hispanic and African American populations to the area east of East Avenue (present-day I-35) by refusing city service to minorities living west of East Avenue. While this practice was prohibited in the 1940s, the population of East Austin remains primarily minority nearly a century after the original enactment of the plan. However, this trend is reversing.
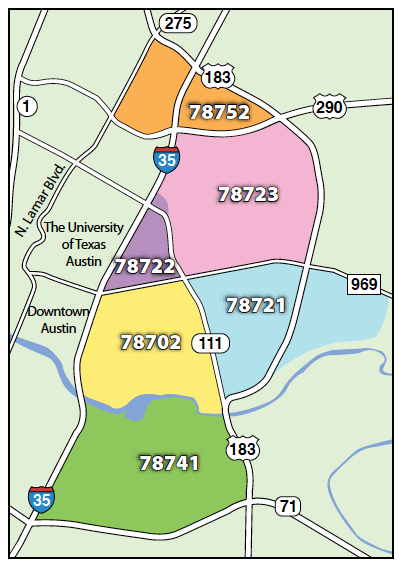
Since 2000, the African American population in East Austin has declined in all but one ZIP code, 78741, which witnessed modest growth of 2.1 percent (see map). While the Hispanic population has grown in several ZIP codes, the growth levels are below Travis County with the exception of ZIP code 78741 (Table 1). From 2000 to 2015, the minority population increased slightly in the two ZIP codes farthest north and south, 78752 and 78741. But the nonminority population has experienced significant growth: 78702, which borders downtown, observed a 25 percent increase in its nonminority population. In essence, while the minority population of Travis County has increased since 2000, the opposite is true in East Austin.

East Austin has also historically housed a large low-income population. In 2000, median household incomes across East Austin measured well below those of Travis County. The median household income for three of the six ZIP codes was around half that of Travis County (Table 2). However, by 2015, the median household incomes of 78702 and 78722, the two ZIP codes closest to downtown, had nearly doubled.
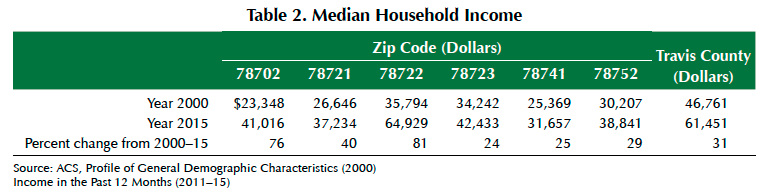
An expanding income gap has contributed to the large growth in household income within certain ZIP codes. In 2014, median household income for 78722 was $54,526. A year later, household income had jumped to $64,929, surpassing that of Travis County, a first for any East Austin ZIP code. From 2011 to 2015, the share of households in 78722 with median incomes of $100,000 or more increased nearly 10 percent (Table 3).

But disparate gains in household income in East Austin have left certain parts of the area lagging the pace of income growth in Travis County. In 2015, the median household income for 78741 was still around half that of Travis County. Unsurprisingly, across the six East Austin ZIP codes, 78741 had the lowest percentage of households with median incomes of $100,000 or more.
Families in East Austin have not fared as well financially as families in Travis County. From 2000 to 2015, median household income recorded higher growth than median family income in East Austin. The reverse occurred in Travis County. By 2015, families in 78741 were earning less than nonfamily households, which include a householder living alone or only with nonrelatives, such as a roommate or unmarried partner. Since 2000, the percentage of families in East Austin whose income falls below the poverty level has increased (Table 4). From 2000 to 2015, within four East Austin ZIP codes this statistic rose more quickly than that of Travis County. Rising unaffordability in East Austin has left families increasingly financially burdened. As median household income continues to grow at a faster rate than median family income, more families will be forced to leave the area.

Housing Stock Constraints, Prices Drive Residents Out
Since 2000, growth in the housing stock in Travis County has outpaced that of East Austin. From 2000 to 2015, the housing stock of East Austin grew 22 percent compared with Travis County’s 38 percent increase. In 78722, the housing stock increased by only 6 percent over 15 years, largely due to the lack of land available for development.
Much of the new construction in East Austin has been oriented toward renter-occupied housing as opposed to owner-occupied housing. In 2015, the share of renters in East Austin approached 70 percent, whereas in Travis County it fell below 50 percent (Table 5). From 2000 to 2015, approximately four times more renter-occupied housing units than owner-occupied units were added to East Austin. However, the share of renters in East Austin increased only slightly. With such a large pool of housing units, even a considerable addition of renter-occupied housing units will only incrementally increase the percentage of renter-occupied units.

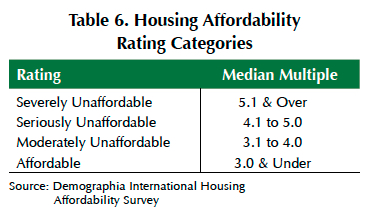
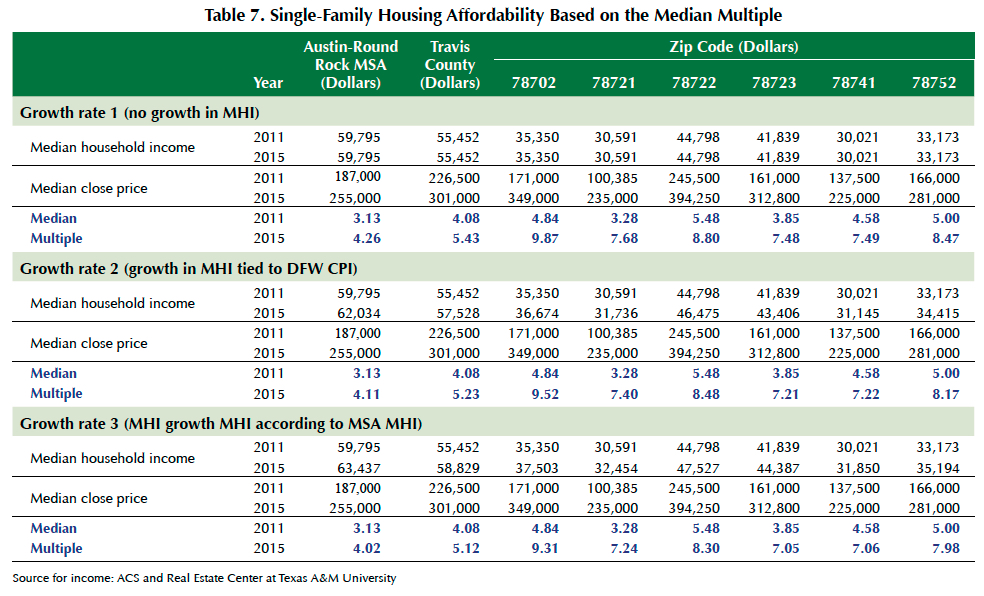
In 2015, Austin was the least affordable of the four major Texas metros. From 2011 to 2015, growth in home sales prices far outpaced that of household income. Previously affordable areas are now unaffordable, leaving homeownership out of reach for much of the population, particularly the city’s low-income residents. In 2011, the Austin-Round Rock MSA, with a median multiple just above 3.0, was still relatively affordable (Tables 6 and 7).
Over the following five years, a near-40 percent increase in home sales prices pushed the median multiple for the MSA into "seriously unaffordable" territory. Inside Travis County, affordability was already an issue by 2011, which recorded a median multiple slightly above 4.0. In 2015, the multiple surpassed the "severely unaffordable" threshold.
Regardless of the considerable increases in home prices over the five-year period, all six East Austin ZIP codes were unaffordable in 2011 (Table 7). While the median multiple for each of the ZIP codes had surpassed that of the MSA, the multiples for two ZIP codes fell below that of Travis County. In 2011, certain areas of East Austin were more affordable than Travis County as a whole. But by 2015, within each income scenario, the median multiples for all six East Austin ZIP codes eclipsed the multiples for the county and the MSA. Many of the multiples for East Austin were double that of the MSA, itself classified as "seriously unaffordable."
Without a doubt, single-family housing unaffordability for potential buyers in East Austin has skyrocketed over the past few years. The area was once considered affordable to the city’s low-income homeowners. It is now only affordable to buyers earning a median household income of at least $100,000 using a median multiple of 3.0. In 2015, the percentage of households in East Austin that surpassed this income threshold hovered between 8 and 28 percent, depending on the ZIP code. It is now virtually impossible for low-income residents to purchase a home in East Austin.
Rents Also Rising
Apartments in Travis County and the MSA offer an affordable solution to single-family housing. Overall, apartments in East Austin are also affordable. But based on the general rule that renters should spend no more than one-third of their incomes on rent, unaffordability is already emerging in East Austin’s two-bedroom apartment sector.
Depending on the number of bedrooms and the income growth scenario, households in Travis County and the MSA spend between 18 and 27 percent of their annual incomes on apartment rent. Residents living in East Austin spend between 28 and 38 percent of their annual income on apartment rent (Table 8).

According to Julian Huerta, deputy executive director of Foundation Communities, apartment rents in East Austin have doubled over the past ten years. To portray this rise in apartment rents, a second measure of apartment affordability was developed. This measure includes only market-rate apartments built from 2000 onwards. While the annual rent-to-income ratios for Travis County and the MSA increase slightly, the ratios remain below the threshold for unaffordability (Table 9).

However, in East Austin, the ratios nearly double. While overall apartments in East Austin are affordable, apartments built since 2000 are unaffordable to the area’s existing population. The median rent for apartments built since 2000 in East Austin is higher than that of Travis County and the MSA. These apartments are primarily located in the ZIP code bordering downtown, 78702, and southeast of downtown, in 78741. Few affordable options are being created for low-income residents. The emergence of new apartment stock will drive up the rents of existing apartments, which will push more residents out of the area.
This research shows that the rapidly increasing cost of single-family homes and apartments will make East Austin increasingly unaffordable to low-income residents long housed in the area.
____________________
Dr. Hunt ([email protected]) is a research economist and Losey a research assistant with the Real Estate Center at Texas A&M University.
You might also like

TG Magazine
Check out the latest issue of our flagship publication.