


What’s in Your Wallet?


 Expansions and contractions in the energy industry drive both booms and busts in Texas. The uneven growth caused by the ups and downs in oil prices is especially present in oil-dependent regions such as Houston, Midland, and Odessa, which benefit greatly in boom periods and suffer when the price of oil falls. In today’s adverse oil price environment, the oil-dependent regions are feeling the hardship in employment and income growth.
The economic performance of a region relies on its industrial makeup and degree of specialization or diversification. Employment and income levels are directly correlated to the industrial makeup and performance of a region. Since the 1980s, the Texas economy has become more diversified, reducing its dependence on the energy industry and making it more resilient when oil prices collapse. Still, the oil industry remains one of the state’s leading drivers of economic growth. Texas is an example of the economic costs of concentration and of the benefits of economic diversification.
In 2014, Texas personal income per capita (PIPC) was slightly below the U.S. PIPC (Table 1). In the long term, Texas kept up with the national growth rate. Recently, PIPC (net of transfers) has converged with and exceeded the U.S. PIPC as a result of increasing income within the state (Figure 1).
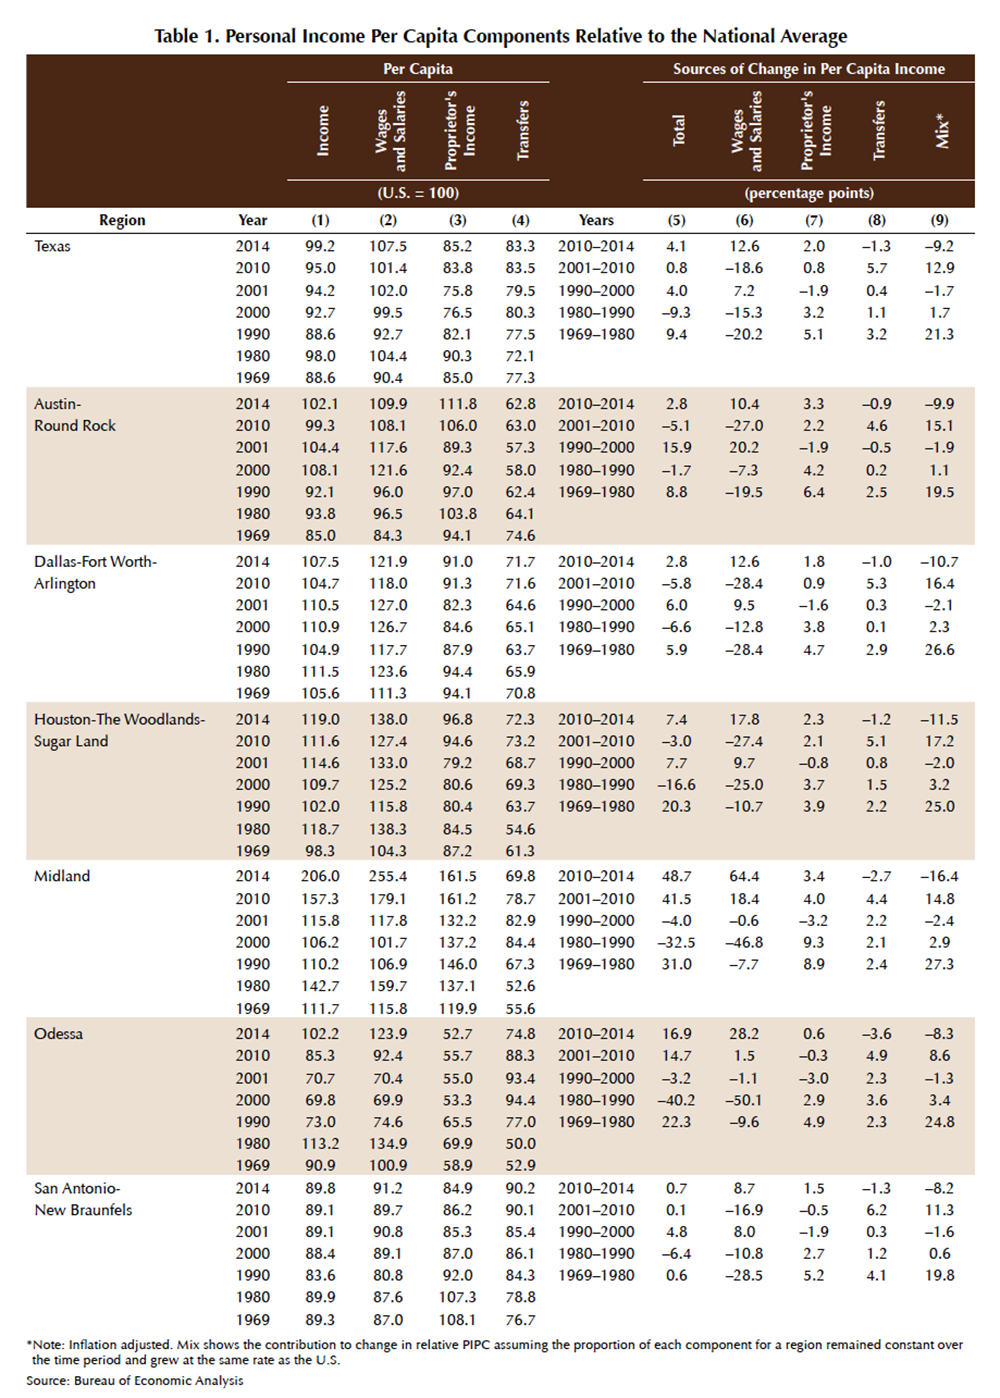

The Houston MSA registered a higher PIPC in 2014 than the nation’s and the rest of the Texas Triangle MSAs composed of the area within Austin, DFW, Houston, and San Antonio (Table 1). The Austin MSA and DFW PIPC achieved a higher PIPC than the U.S., respectively, while the San Antonio MSA ranking was below the nation and the other major Texas MSAs (Table 1).
Two MSAs with significant oil and gas activity, Midland and Odessa, exhibited strong levels of PIPC in 2014 (Table 1). In fact, during 2014 Midland had the second highest PIPC levels in the nation (behind the Bridgeport-Stamford-Norwalk, CT MSA). Houston, Midland, and Odessa are considered Texas’ major oil MSAs where PIPC has experienced exceptional growth, reaching levels well above the nation. On the flip side, these regions have also experienced more volatility during downturns in the oil and gas industry.
Hereafter, any reference to PIPC is net of transfers (for example, Social Security and welfare payments) as they do not constitute earnings currently worked for. Transfer payments—which include payments to the unemployed—rise most in periods of economic decline. Our interest is income paid out for employment and property ownership in the prevailing regional economic activities.
Ranking U.S. MSAs by the average annual inflation-adjusted growth rate in PIPC from 1969 to 2014, Texas major oil MSAs (Houston, Midland, and Odessa) rank 16th, 1st, and 21st out of 381 metros, respectively (Tables 2 and 3). The Austin MSA, a region more based in technology, education, and state government, is also near the top of the rankings at 15th. The DFW and San Antonio MSAs are a little farther down the list at 99th and 157th, respectively. The DFW MSA is an important transportation, business and financial services, and technology region that is highly related to the U.S. economy. San Antonio, in comparison, traditionally has been a tourism and military service area. Using the same comparison by state, Texas ranks 11th out of the 50 states.

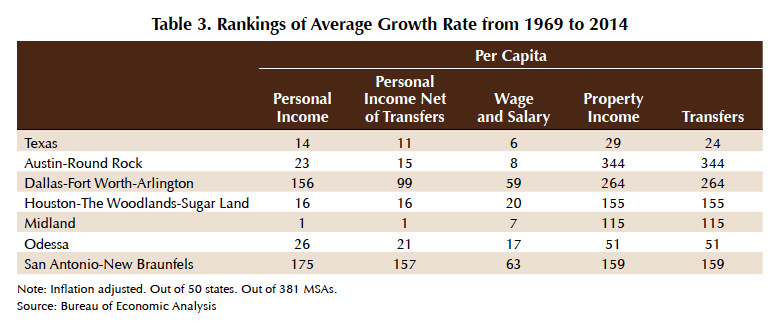
Texas’ four major MSAs (Austin, DFW, Houston, and San Antonio) match or exceed the U.S. annual inflation-adjusted average growth from 1969 to 2014 (Figure 2). Wages and salaries per capita is a more accurate picture of income paid for work completed. It does not include earnings from self-employment, business investments, other passive investments or transfer payments from the government as does personal income. The Houston, Midland, and Odessa MSAs slide to 20th, 7th, and 17th, respectively. The Austin MSA jumps to eighth while the DFW and San Antonio MSAs increase to 59th and 63rd, respectively. Both personal income growth and wage and salary growth suggest that it pays to be in oil and gas, at least in Texas.
To determine the degree of industrial specialization, location quotients (LQ) are used to compare a region of interest with a benchmark region. An LQ is simply the proportion of employment in an industry for a region divided by the proportion of employment in the same industry for the benchmark region. A value of greater than 1.0 suggests that the region of interest has a greater proportion of employment in that industry relative to the benchmark region, which in this case is the U.S. The data on employment from the Bureau of Economic Analysis (BEA) is used to estimate the LQs by state and MSA.
Ranking the top U.S. MSAs in PIPC annual inflation adjusted growth from 1969 to 2014, three of the five top-ranked MSAs have a mining, based concentration (Table 2). The Midland MSA was ranked first followed by the Lafayette (LA) MSA at third and then by the Houma-Thibodaux (LA) MSA at fourth. All three on average from 2001 to 2014 registered high LQs in the mining sector, respectively.
The other two MSAs that round out the top five are Fayetteville-Springdale-Rogers (AR-MO) followed by Bridgeport-Stamford-Norwalk (CT). The Fayetteville-Springdale-Rogers (AR-MO) MSA is specialized in management of companies and enterprises, and in transportation and warehousing services, all related to Walmart operations (Table 2). The Bridgeport-Stamford-Norwalk (CT) is concentrated in finance and insurance, and in the management of companies and enterprises (Table 2).
The average LQs from 2001 to 2014 are estimated for the remaining Texas MSAs. The Austin MSA specializes in state government, professional, scientific and technology, and information. Interestingly, the Austin MSA registers an LQ greater than 1.0 in mining, indicating some specialization in the oil industry (Table 1). The Houston MSA not surprisingly specializes in mining. The DFW MSA is concentrated in finance and insurance, and also in mining. The other major oil region in Texas, the Odessa MSA, is concentrated in mining, followed by wholesale trade and construction. The relatively high LQs for Austin and Dallas in mining reflect the importance of the oil industry in the State of Texas even in regions not considered part of the state’s energy industry. Texas has a high LQ in mining, reflecting the state’s specialization in the sector. When ranking U.S. states by LQs in mining, Texas registers the seventh highest.
Texas PIPC vs. U.S. PIPC
Texas PIPC levels recently have shown a pattern of convergence toward U.S. levels, while Texas MSAs exhibit their own distinctive patterns of convergence or divergence. Figure 1 shows income levels relative to the U.S., where the U.S. is equal to 100 from 1969 to 2014. A region above a 100 means that PIPC levels are above the U.S. and a region below 100 has PIPC levels below the U.S. A series that approaches 100 suggests convergence while a series that moves away from 100 suggests a divergence.
Texas has hovered around the U.S. average since 1969. The Arab oil embargo, which started in 1973, prompted concerns over a shortage of oil in the U.S. and led to increased domestic production, especially in Texas. From the mid-1970s to early 1980s Texas experienced an oil boom with increasing oil prices. Oil peaked in 1981 as a result of a sharp decrease in prices that in turn affected earnings and employment in the oil and gas industry. Relative to the nation, income levels in the Houston, Midland, and Odessa MSAs increased dramatically during these oil boom years and subsequently decreased as oil prices fell. Even with the decline after 1981, the Houston and Midland MSAs held on to PIPC levels above the nation throughout the entire period. The Odessa MSA took a much harder hit to income levels following the bust as more blue-collar energy jobs are present in this region, compared with the Houston and Odessa MSAs, which have a higher number of white-collar energy jobs.
The other major Texas MSAs (Austin, DFW, and San Antonio) also benefited from overall economic growth underpinned by the booming oil and gas activity. PIPC levels increased relative to the U.S., but lost territory following the 1980s oil bust. Interestingly, these three MSAs declined a couple of years following the initial shock in 1981 to the oil MSAs (Houston, Midland, and Odessa). While the Houston, Midland, and Odessa MSAs have more direct ties to the mining industry, the Austin, DFW, and San Antonio MSAs have indirect ties shown by the much later decline in income levels. In addition, the U.S. economy fell into recession during that period, causing PIPC to decline nationally.
Texas PIPC levels remained below the national average after the 1980s oil bust until shortly after the Great Recession of 2008–09. Prior to the financial crisis, Texas PIPC levels began to increase from being nearly flat from the late 1980s until the early 2000s. Then, they began to trend toward convergence with the national average. Much of this lift was brought about by increasing income levels in the oil MSAs, which started to increase in the early 2000s.
Throughout the 1990s, the Austin MSA registered increases in PIPC concurrent with the tech boom. Income levels ballooned around 2000 and declined with the dot-com bust but remained above the national average. Income continued to increase above U.S. levels in the following years. From the mid-1990s, the Houston MSA’s PIPC began to increase at a consistent pace. Just as the Texas oil MSAs were the first to be hit after the oil bust in the 1980s and the other MSAs followed with declines in PIPC, the Austin MSA was the first to be hit with the dot-com bust. Austin’s decline started in 2000, followed by the other major Texas MSAs starting in 2002 as the country and the state fell into recession.
The number of operating rigs in Texas increased from 306 in April 2002 to a peak of 946 in September 2008. The Houston, Midland, and Odessa MSAs began to see a run-up in income levels beginning in the early 2000s congruent with increasing oil activity in the state. Following the Great Recession of 2008–09, PIPC decreased slightly for Texas and more strongly for the Houston, Midland, and Odessa MSAs as a result of disinvestment and sidelining of capital. Oil prices tumbled to below $40 per barrel in early 2009. Oil prices rebounded and activity began to increase as the economy improved. PIPC began to increase again. Income levels relative to the nation in the late 2000s and the turn of the decade are on par or exceeded those in the late 1970s and early 1980s for the Houston and Midland MSAs after adjusting for inflation (Figure 1). The Odessa MSA, characterized as a more blue-collar oil region, has experienced an increase in PIPC but not as much as the Houston and Midland MSAs.
As of 2014, PIPC levels in the Midland MSA were 2.34 times the national average and second highest in the nation behind the Bridgeport-Stamford-Norwalk (CT) MSA which has consistently remained in the top five over the entire period. The Houston and Odessa MSAs’ PIPCs were 1.29 and 1.08 times the national average, respectively. Quantity of oil production in Texas was not significantly impacted by the Great Recession of 2008–09. Oil production begin to decrease slightly in late 2014. The number of operating rigs has been more variable, demonstrating that the industry has maintained output while increasing operating efficiency; that is, the number of rigs required for X amount of output has decreased, reflecting the increase in productivity. Despite the decrease in operating rigs, PIPC has remained elevated through 2014 in the state’s energy MSAs.
How Has PIPC Grown in Each Region?
To examine how PIPC has grown in each region relative to itself, we establish a starting point in 1969 by indexing income levels to 100. Regions with lower levels of PIPC tend to converge with those that have a higher PIPC. Table 4 shows the ranks of PIPC in various periods. Each of the Texas MSAs exhibits improvement from its 1969 ranking by 2014, even in the aftermath of various negative ailments like the Great Recession of 2008–09.
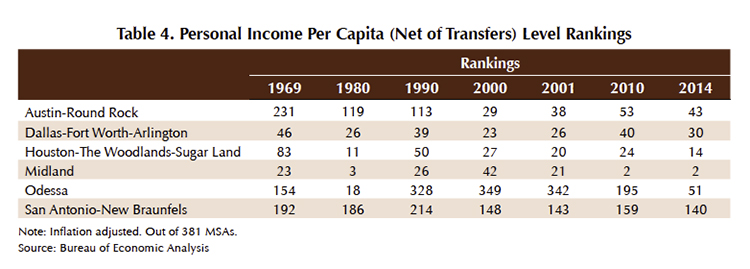
Figure 2 indexes PIPC at 100 with a base year of 1969. Texas as a whole has matched or exceeded the U.S. in terms of growth throughout the entire period studied. Focusing on the oil MSAs, there is exceptional growth through 1981. Afterward, income levels drop hard until the mid-to-late1980s. During that period Midland maintained growth levels consistent with the U.S., while Odessa experienced sluggish growth due to the depressed oil economy. The presence of a blue-collar energy labor force in Odessa compared with a white-collar one in Midland played a role in the growth performance between both regions.

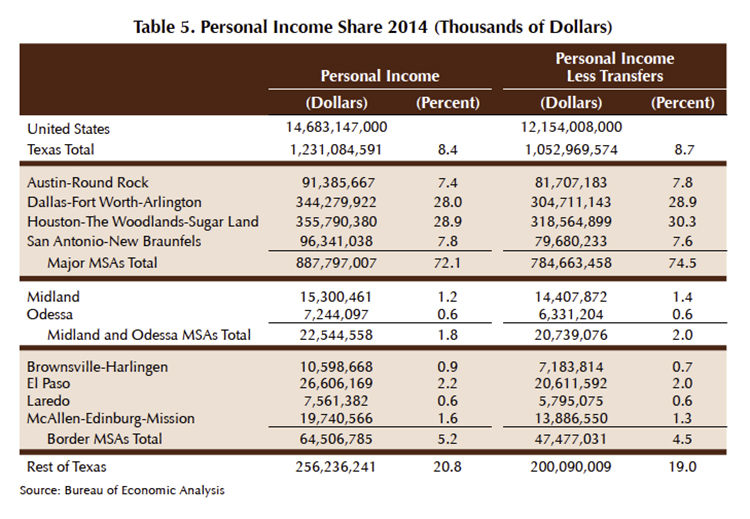
The Houston MSA’s growth in the long run has exceeded the nation’s and has been a large positive influence on the state’s PIPC levels. Personal income for the Houston MSA accounted for more than one quarter of the state’s personal income in 2014 (Table 5). The Midland and Odessa MSAs, even with their strong per capita levels, only contribute around 2 percent between them to the state’s personal income (Table 5).
The Austin MSA is known for its strong government sector as the state capital and as home to the University of Texas and its high-tech sector. It has also emerged as a leader in income growth, especially during the late 1990s, thanks to its high-tech specialization. At the turn of the millennium, income levels for Austin peaked and dropped sharply relative to other regions. All regions experienced a decline in personal income as a result of the tech bubble. Austin has consistently had a high growth rate and has remained above the nation’s income levels since the early 1990s (Figure 1). Austin boasts the greatest improvement in PIPC level ranking, from 245th in 1969 to 64th in 2014.
The DFW and San Antonio MSAs consistently followed the U.S. growth rate (Figure 2). DFW maintained income levels above the U.S., while the San Antonio MSA has consistently been below the U.S. The DFW MSA is a diversified region that includes transportation services and manufacturing but is closely correlated to the performance of the U.S. economy. It is home to a major inland transportation hub for the nation, especially for states such as Louisiana, Arkansas, and Oklahoma. The DFW airport has consistently remained in the top ten list for world’s busiest airports in terms of passenger traffic. Though not as specialized as the Houston and Midland MSAs, the DFW MSA has a significant tie to the oil and gas industry as well as the high-tech industry, which was a major source of growth in the 1990s. The San Antonio MSA is a major distribution point for South Texas and northern Mexico—a role that has grown with the rapid expansion of the maquiladora industry. The San Antonio MSA is a major tourist attraction with historic monuments and recreational parks, while also having a strong government presence with Lackland Air Force Base, Fort Sam Houston, and Randolf Air Force Base.
Growth or Variability?
Just as an individual strategizes the diversification of a retirement account to balance growth with acceptable levels of risk, diversification of industries in a regional economy has bearing on the variability of income levels. A high concentration in an industry leaves the regional economy susceptible to shocks in that industry. While the oil MSAs have experienced high levels of PIPC growth and high levels of PIPC relative to other metros, they also experience more variation. Oil booms and busts contribute to this variability in PIPC.
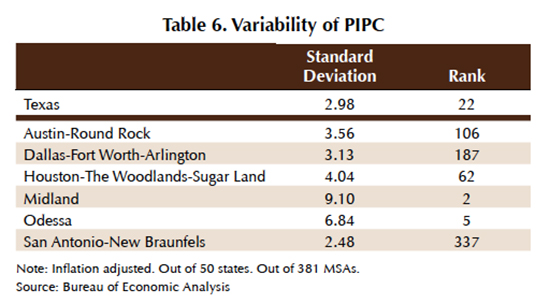
The Midland MSA registered the highest average inflation-adjusted growth rate from 1969 to 2014 for all U.S. MSAs. It also registered the largest standard deviation in terms of growth rates in the state and second in the nation (Table 6). This variability is a result of the boom-and-bust periods in the oil industry, and is also present in the other oil MSAs. The Odessa and Houston MSAs register a standard deviation that ranks them second and third in the state and fifth and 62nd in the nation, respectively. The Houston MSA weathers the storm better than its oil counterparts through increased diversification in other industries such as health care services, and trade through its port.
Components of Income Growth
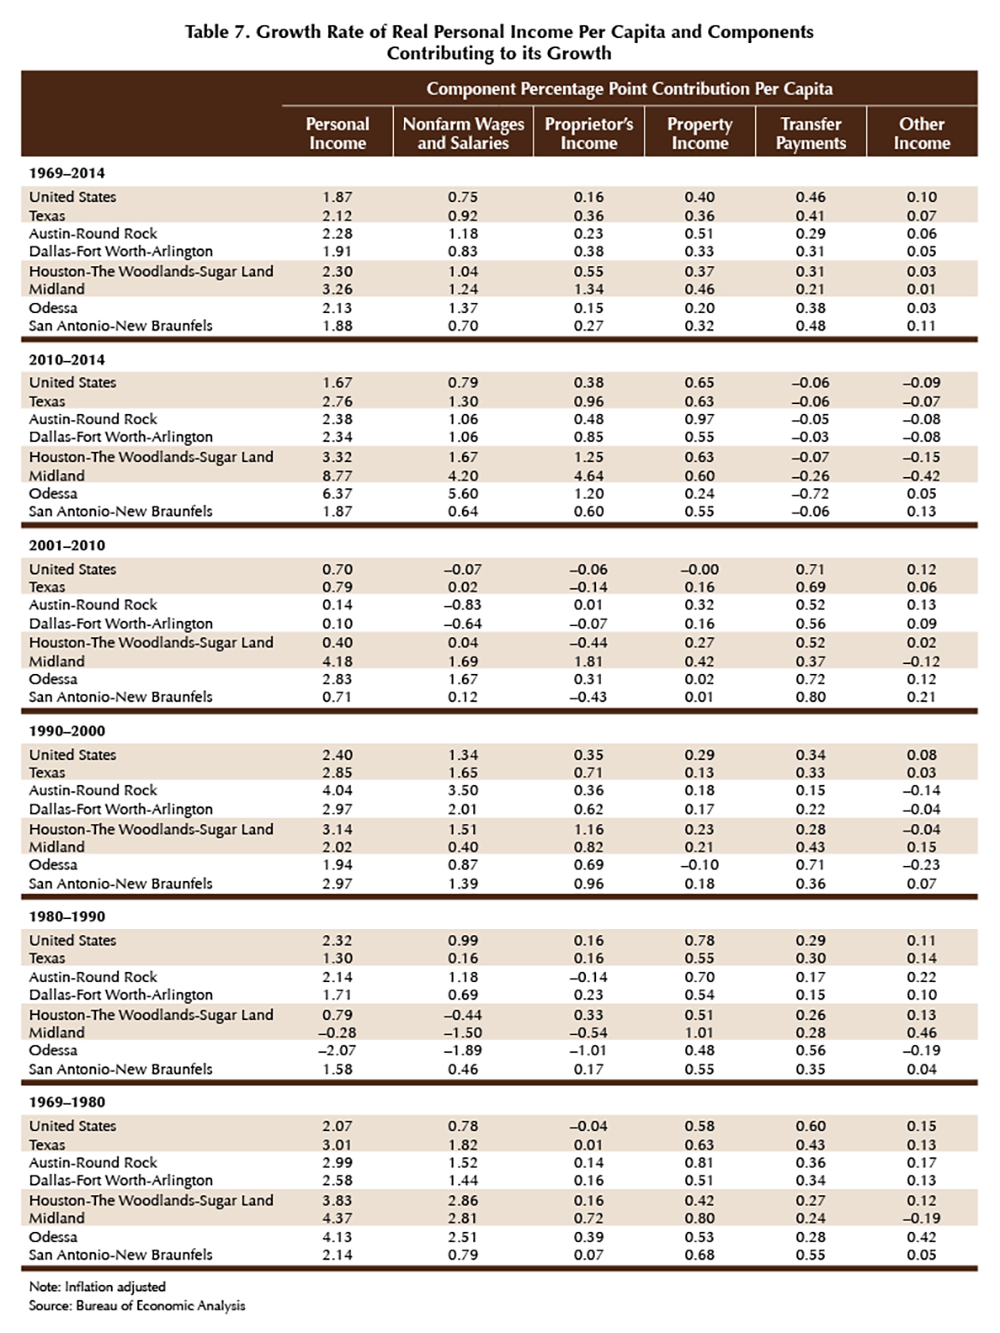
As previously mentioned, personal income is composed of multiple sources of income with wages and salaries being dominant. Other sources include proprietor’s income, property income, transfer payments, and other income. When considering only wages and salaries per capita, the Midland MSA drops from first to seventh, showing other sources of income at work in the growth of PIPC (Table 3). Proprietor’s income and property income are two other sources of income that play a strong part in overall personal income growth. In the case of Texas and its MSAs, wages and salaries exhibited higher growth rates in the periods when oil busts are absent, and during oil bust years, wage and salary growth contributes less compared with other sources of income (Table 7). Following the oil bust in the 1980s, proprietor income contributed a larger portion to PIPC growth than it had before for both the Houston and Midland MSAs. In Texas, new businesses had presumably been started by the unemployed turned self-employed during and after the downturn.
Between 1969 and 1980, Texas performed strongly, exceeding the U.S. growth rate. All the major MSAs posted growth rates higher than the national average. Wages and salaries were the strongest contributors to PIPC growth. In contrast, between 1980 and 1990, the state underperformed the nation, registering a 1.30 percent average inflation-adjusted growth rate compared with 2.32 percent by the U.S. The Midland and Odessa MSAs saw negative growth rates in PIPC and its component, wages and salaries. In Midland, property income contributed positively, likely from a prior run up in housing prices and in turn higher rental values (Table 7).
From 1990 to 2000, once again Texas surpassed the U.S. growth rates, and the Austin MSA emerged as the Texas MSA leader in PIPC growth followed by the Houston MSA. Wages and salaries were the major contributor for the Austin MSA and were responsible for 87 percent of increases in PIPC (Table 7).
The 2000 to 2010 decade experienced two economic downturns, the tech bubble in 2001 and the financial crisis from 2008–09. Growth in PIPC occurred after the tech bubble and through the middle of the decade, but most of the gains in PIPC were erased with the financial crisis downturn. Texas performed mildly better than the nation in terms of overall personal income growth and wage and salary growth. The Midland and Odessa MSAs made up for losses following the financial crisis with gains resulting from increases in oil and gas activity. Growth throughout the other MSAs was minimal. The contribution of transfer payments to PIPC growth was larger during this decade than at any other period (Table 7).
The period from 2010 to 2014 saw a boom in the oil industry and the beginning of the U.S. economy’s recovery that benefited regional PIPC growth. Texas PIPC rebounded strongly relative to the nation due to the oil boom. The oil MSAs led all the state’s MSAs for PIPC growth. Growth was predominantly and almost equally driven by both wages and salary income and proprietor income in the Houston and Midland MSAs. In the Odessa MSA, wage and salary growth was the major contributing factor to overall PIPC growth (Table 7).
Earnings per Job
Earnings is the sum of three components of personal income: (1) wages and salaries, (2) supplements to wages and salaries, and (3) proprietor’s income, providing an indicator of pay received for work performed. The BEA provides earnings and employment by industry for each region. The levels of pay for jobs in each industry can be compared. Tables 8a and 8b show that earnings per job in an industry are not always equal across the MSAs.
In 2014, a mining job in the U.S. paid $108,704 and in Texas paid $156,450. The Houston MSA is home to many of the oil and gas company headquarters, concentrating a large number of white-collar jobs. Not surprisingly, the Houston MSA with $270,576 registers the highest earning level in mining followed by the Midland MSA with $171,300 and the DFW MSA with $158,750. The Odessa MSA with $95,623 earnings in mining does not reach the levels of the other oil MSAs.
A relationship exists between a region’s specialization in the oil industry and its contribution in achieving higher average earnings. White-collar jobs pay significantly more than blue-collar jobs and affect average earnings in the oil MSAs.
In 2014, jobs in construction, manufacturing, transportation, communications and public utilities, and wholesale trade registered earnings above the U.S. and contributed to overall higher earnings and growth (Table 8a).


Conclusion
Texas PIPC has maintained levels around the national average and growth rates that have exceeded the nation. Texas has achieved economic progress by raising the state’s living standards while outperforming the U.S. The economic progress has been uneven over time as oil boom periods have pushed Texas PICP upward and in the subsequent collapsed have dragged Texas PIPC levels downward (Figure 3). Overall, the presence of the oil industry has benefited Texas.

The increases in the state’s living standards have been geographically uneven. Texas MSAs have registered different levels and growth of PIPC as a result of the particular characteristics of the regional economies. The economic progress in the state has mostly come from the Texas Triangle MSAs of Austin, DFW, Houston, and San Antonio as the majority of the state’s personal income is generated in this region.
The oil MSAs have benefited from booms, but in times of bust, PIPC levels take considerable hits. The Midland MSA has reached PIPC levels that place it at the top of the nation. The Houston MSA has fared exceptionally well as a world energy hub. A more diversified base has allowed the Houston MSA to take advantage of the booming oil sector while mitigating the downfalls with the specialization in other sectors such as health care. In contrast, because the Midland and Odessa MSAs are highly concentrated in the oil industry, both register greater declines in income levels during oil busts. A distinction should be made between white- and blue-collar energy-dependent regions. Houston and Midland are considered white-collar regions and have registered greater economic progress even with the ups and downs in the oil industry compared to Odessa, a blue-collar region.
The Austin MSA has performed exceptionally well given its ties to the technology sector even though it registered a fall in income levels after the tech bust. The DFW MSA has a more diversified economy that includes a technology sector, transportation, and financial services, which have allowed it to maintain consistent personal income levels above the U.S. over time. The San Antonio MSA income levels are consistently below the nation although its growth rate has kept pace with the country because of the strong presence of the federal government, military bases, and tourism services.
As Texas confronts a bust period in the oil industry that will drive down the states personal income levels in 2016, its economic progress should persist given the state’s industrial makeup and degree of specialization in the energy and technology sectors and diversification in service industries such as transportation and warehousing. Considering the state’s favorable business climate translates into cost advantages, Texas should continue making progress in raising its living standard in the foreseeable future.
____________________
Dr. Torres ([email protected]) is a research economist and Wayne Day a research assistant with the Real Estate Center at Texas A&M University.
You might also like

TG Magazine
Check out the latest issue of our flagship publication.