


Things Change


Prices aren’t the only things that changed for housing during the pandemic. The physical characteristics that buyers looked for in houses also changed, and in predictable ways. |
Recently, home prices have grown more than four times faster than the 2012-19 annual trend of 5.27 percent. From January 2020 to May 2022, the average selling price of a home in Texas rose from $278,542 to $443,856. This 59 percent increase over two years and four months is equivalent to a 22 percent annualized growth rate. Broadly speaking, the main cause of this rapid price run-up was a rapid fall in interest rates while most typical homebuyers remained employed.
However, the average price could also have been influenced by what is called a composition effect. For example, many have postulated that homebuyers shifted their preferences to larger homes because of COVID-19. They may also have shifted in that direction as mortgages became cheaper. Regardless of the reason, that shift in demand to larger and presumably more expensive homes would cause the reported average price to increase even if no individual home actually increased in price.
The Texas Real Estate Research Center’s (TRERC) Home Price Index (HPI) attempts to control for these composition effects and provide a more reliable indicator of average house price changes. Are signs of composition effects evident? If so, how do those composition effects impact the relationship between the average transaction price and the HPI?
Age of Homes Sold
Before COVID, the median age of purchased homes in Texas had been trending upward. It trended down during the pandemic, then returned to and rose above trend starting in mid 2021 (Figure 1).
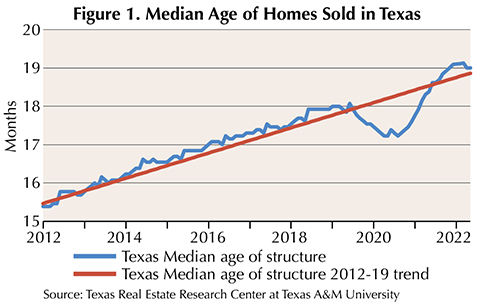
The linear trend is estimated using 2012-19 data, then pulled forward through May 2022. The median age of a home sold in Texas fell significantly below trend in 2020, recovering in 2021 and 2022 likely due to fewer newer homes on the market. Figure 2 shows the divergence from the trend line, confirming the pattern.

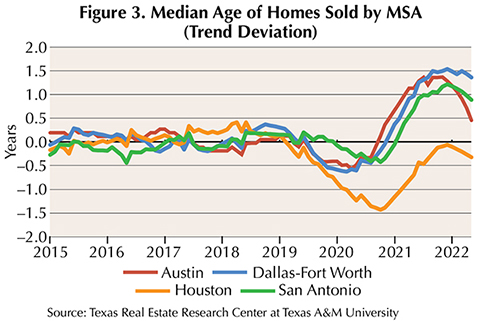
A similar methodology was used for Texas’ four major Metropolitan Statistical Areas (MSA) (Figure 3). All four MSAs followed similar patterns as the state: an apparent drop in the median age of sold homes through 2020 relative to trend, with marked increases in median age through 2021 into 2022 in Austin, Dallas-Fort Worth, and San Antonio. Houston’s path favored much newer homes in 2020 with a return to trend in 2022, but the story is essentially the same.
Square Footage of Homes Sold
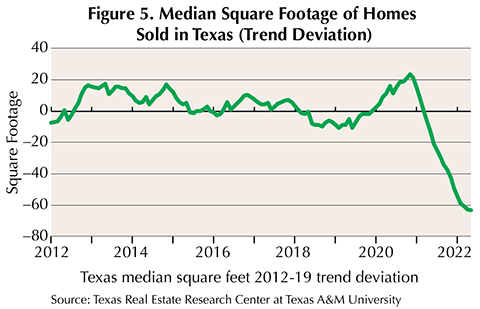
The median square footage of homes sold in Texas had been on a slight trend upward from 2012 until COVID hit (Figure 4). As with age, a linear trend was estimated for 2012-19 then pulled forward through 2022. Figure 5, which shows the deviation from the trend, reveals an increase in median square footage through 2020 followed by a collapse to well below trend through 2021.

Texas’ major MSAs show a similar pattern (Figure 6). San Antonio stands out due to the linear trend assumption not holding from 2012-19. Something else was occurring in San Antonio, and the city’s median square footage peaked in 2015. Despite that, San Antonio follows the underlying shifts common across Texas: square footage follows a trend, increases above that trend in 2020, then falls below trend through 2021 and into 2022.

Difficulty Interpreting Price Changes
Changes in the housing stock being traded make interpreting price changes difficult. If people shift toward purchasing larger homes in a given month, the average sold price for that month will increase even if none of the houses on the market increased in price.
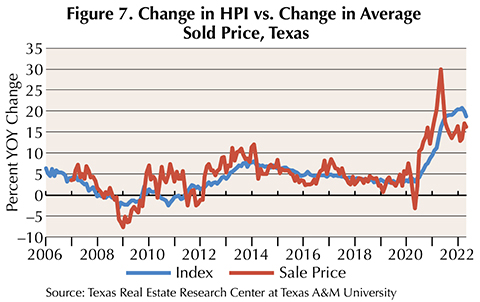
This difficulty can be lessened in Texas using TRERC’s HPI. The influence of composition effects are apparent with average sales prices increasing more than the indexed prices as the market composition shifted toward newer and larger homes through 2020 (Figure 7). In 2021, the values reversed as the market ran out of those larger and newer homes. Figure 8, which uses the HPI growth rate minus growth in average sales price, shows the same pattern held for each of Texas’s major metropolitan regions.

People don’t always completely change their minds about buying a home just because of a major shock in the housing market. Often, they’ll simply change the characteristics of the home they planned to buy. TRERC’s HPI controls for these composition effects to provide a better measure of value increase across a given home market.
____________________
Dr. Perdue ([email protected]) is a research
economist with the Texas Real Estate Research Center at Texas A&M University.
You might also like

TG Magazine
Check out the latest issue of our flagship publication.