


States of Housing


Texas’ population, employment, and income growth are still ahead of the nation as a whole. However, some states are gaining ground, making them as attractive as Texas to some homebuyers. |
Texas fared better than most of the United States during and after the Great Recession (GR), thanks in part to its diverse economy (e.g., oil fracking and the technology sector) and stronger housing market fundamentals.
Elements that affect housing demand include demographics, income and employment growth, interest rates, and locational characteristics such as schools, work centers, and transportation. Supply fundamentals include building permits, housing starts, construction costs, and land costs. Two principal housing factors contributing to Texas’ relative success after the GR were overall housing affordability and much less reliance on extreme subprime home financing during the housing boom.
Texas’ favorable economic conditions attracted new residents who bought homes, supporting the housing market. In recent years, however, the nation’s economy has improved, reducing the Lone Star State’s attractiveness.
To evaluate how Texas measures up ten years after the GR, the Real Estate Center compared Texas’ current housing market fundamentals to those of some fast-growing states (Arizona, Colorado, Washington, and Florida) and some with slower growth (California and New York).
Who’s Growing, Who’s Not
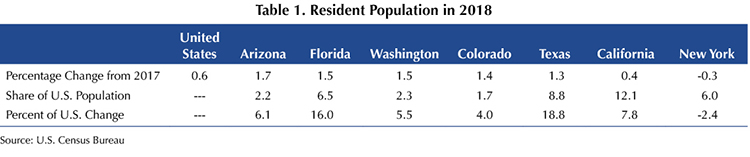
Population growth is among the top drivers of housing demand, so it provides much insight into a housing market’s future. California is the most populous state with an estimated 39.6 million residents in 2018, followed by Texas (28.7 million), Florida (21.3 million), and New York (19.5 million). Washington and Arizona ranked 13th and 14th with 7.5 million and 7.2 million residents, respectively. Colorado placed 21st with 5.7 million residents.
Since the start of the 21st century, population growth patterns of these seven states have generally followed the same trends (Figure 1). After accelerating in 2014, growth has slowed nationwide and in these seven states. Following the recovery from the GR, however, population trends in California and New York have diverged from the other states, as neither experienced a significant post-recessionary rise in growth. In the last three years, California’s population growth has registered below the nationwide average, and the Empire State’s population has contracted. Arizona was also an outlier, accelerating to its highest growth rate in ten years in 2018 (Table 1).

Between 2011 and 2018, the U.S. averaged 1.7 percent employment growth. Since 2015, growth has slowed as retail contractions weighed on acceleration in goods-producing sectors. All seven states included in this analysis exceeded the national benchmark except for New York, where payrolls grew 1.6 percent since 2010. New York is on track for even slower growth in 2019 if the pace in the first eight months continues. Retail trade was the largest drag on New York’s workforce, contracting for the third consecutive year. The education and health services sector, however, accelerated to 3.7 percent growth.
Arizona employment grew at the fastest rate in 2018, increasing 2.8 percent and exceeding its 2011–18 average of 2.3 percent. Professional/business and education/health services contributed to much of the growth, although the former shows signs of deceleration. Washington payrolls expanded 2.6 percent, surpassing the 2.3 percent eight-year average as education/health services and leisure/hospitality jobs were added at a faster rate. Florida and Colorado each grew 2.4 percent but fell short of the average 2.6 percent growth. Texas employment expanded 2.3 percent in 2018, just 0.1 percent below its 2011–18 average. California job growth decelerated for the third consecutive year, slowing to 2 percent as the state’s education/health services sector fell below 3 percent growth for the first time since 2011 and retail employment contracted. The Golden State’s eight-year average was 2.3 percent.
Since the GR, real personal income per capita (RPIPC) across the states moved in the same general direction as the nationwide average. In second quarter 2019, the U.S. registered 2.9 percent year-over-year (YOY) growth in RPIPC. Florida and New York fell short of the benchmark, recording 2.6 and 2.7 percent YOY, respectively. Arizona (3.1 percent), Texas (3.2 percent), Colorado (3.3 percent), California (3.4 percent), and Washington (3.6 percent) exceeded the nation’s improvement.
More People Mean More Housing
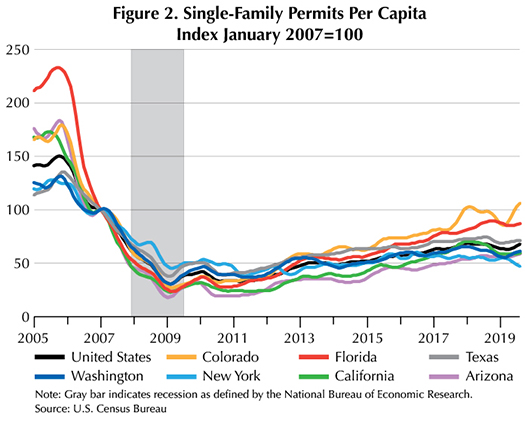
Population growth spurs the need for new housing. One measure of new homes is the number of residential permits and starts issued per capita. From 1991-2007, Arizona led the seven states in single-family permitsissued per capita. Texas then dominated per capita issuance until 2015. Most recently, Colorado has held onto the top spot. As of August 2019, it is the only state in this analysis that has reached the same level of activity as in January 2007 (Figure 2). All the other states, except for New York, registered some degree of growth in 2019.
Arizona and Texas had the most housing starts per capita in January 2007, followed by Washington, Colorado, and Florida. New York and California measured beneath the nationwide level. As of August 2019, Florida led the comparison, followed by Texas, Colorado, Arizona, and Washington. California and New York starts remained below the U.S. metric. All states have trended upward in 2019 except for New York and Washington, where signs of decline are apparent, and Arizona, where the trend has recently flattened. Similar to permits per capita, only Colorado starts-per-capita have regained lost ground since January 2007 (Figure 3). Supply measures haven’t returned to precrisis highs in any of the seven states or nationally.

Construction costs differed from region to region. According to the U.S. Census Bureau, the nationwide median cost per square foot of a new single-family home in 2017 was $101.25. The South (including Texas and Florida) registered $95.35. The West (Arizona, Colorado, and California) and Northeast (New York) were higher at $126.42 and $148.95, respectively. Higher construction costs increase home prices, thereby decreasing affordability.
Texas Tops in Home Sales
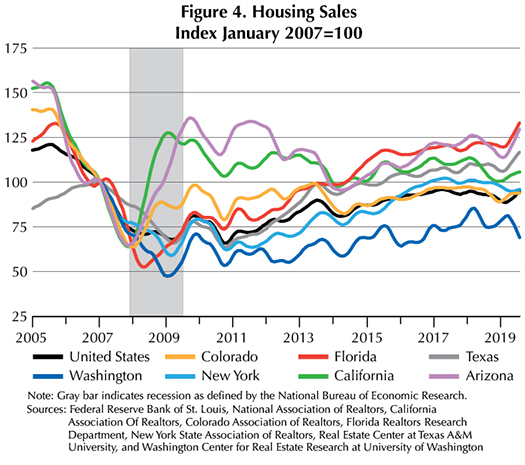
Texas fared better than the nation and the other six comparative states in home sales, falling the least from its prerecession peak to trough in terms of percentage change. Texas is the only state to have recovered completely from the GR, surpassing its predownturn record high in October 2014 (Figure 4). If Florida sales continue to trend upward, the Sunshine State will be the next to exceed precrisis levels.
Of the seven states analyzed, Texas’ median home sales price was the first to reach its trough during the GR, but it was also the fastest to recover, rebounding in less than two years. Due in part to stricter lending standards than most of the country and a more robust economy, Texas’ housing bubble was not as extreme, with the lowest median price recorded during the crisis only 8 percent below the prerecessionary high. As of June 2019, Texas’ median price was 72 percent higher than the recession’s low (Table 2). In Colorado and Arizona, the median price has increased one-and-a-half times from its recessionary trough. Texas’ median price in June 2019 was 58 percent higher than its prerecession maximum. Washington registered the second-highest gap at 31 percent.

One of the simplest estimates of housing affordability is the median multiple; that is, the ratio of the median home price to median annual household income. A lower ratio indicates the annual median household income has more purchasing power against the median home price. As of June 2019, only Texas’ median multiple is higher than its January 2007 level (Table 3). The Lone Star State, however, registered the lowest ratio in 2007, and it boasts the same today, implying Texas is still relatively the most affordable state in this analysis.
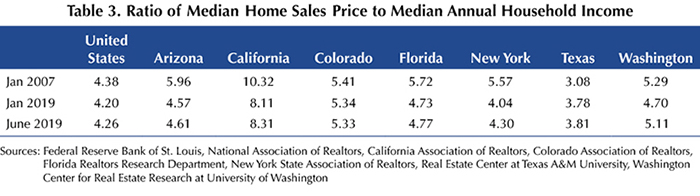
States whose housing markets got hit the hardest during the GR (California and Arizona) show the largest decrease in their respective median multiples due to the median home price falling to greater degrees in the aftermath of the housing bubble’s burst. In the past year, the median multiple has increased in nearly all comparative states as well as in the U.S., indicating decreasing affordability. Arizona was the exception. Its data showed signs of easing in 2Q2019.
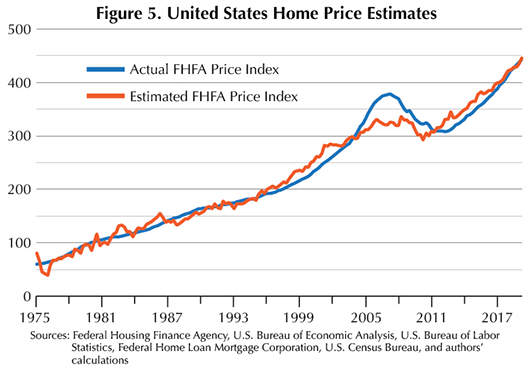
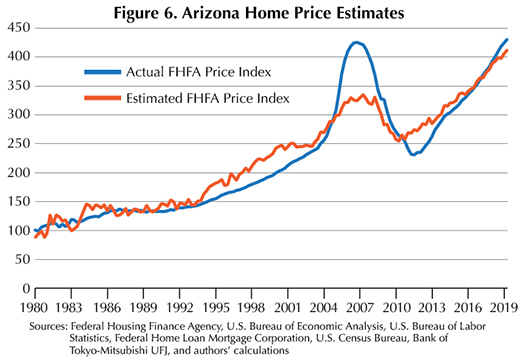
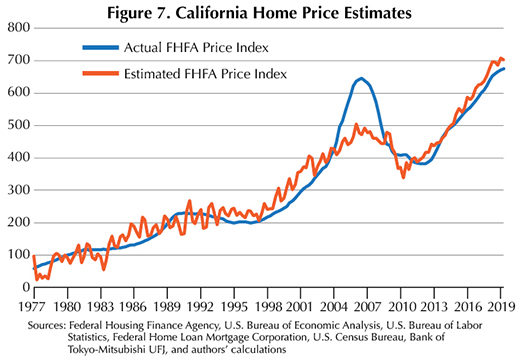
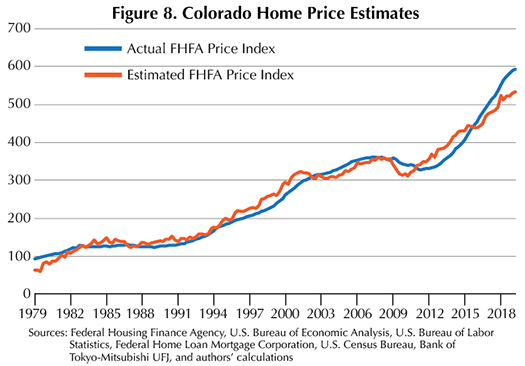
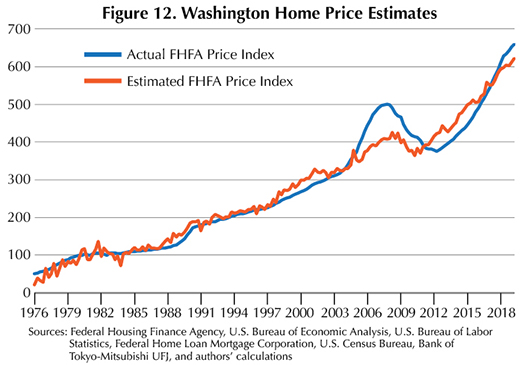
Comparing 2Q2019 actual FHFA values to estimated FHFA index values, the nationwide consensus seems to be that home prices are in line with market fundamentals (Figures 5-12). New York and California home prices may be slightly undervalued, but estimated values are within 10 percent of actual values. Arizona, Washington, and Florida’s actual index values are greater than estimated values but by less than 10 percent. Colorado and Texas housing markets show the greatest price misalignment with the actual indices 11.5 and 17.5 percent greater than the estimated value, respectively. A possible explanation for these disparities is the demand for entry-level housing is outpacing supply in each of the markets.


Who Has the Economic Edge?
Ten years ago, Texas fared better than the rest of the country coming out of the GR. Does that hold true today? In terms of population, Texas’ annual growth rate remains above the nationwide average, although other states appear to be catching up after a seven-year period where Texas ranked consistently among the top three fastest-growing states.
Employment and income data showed growth exceeding that of the nation’s, but other states are performing just as well or better in recent years.
Less expensive construction and land costs combined with a low-regulatory environment foster residential permit issuance and construction starts. Affordability still challenges the Texas housing market, albeit to a lesser degree than many other states, which may explain why Texas is the only state in this analysis to have recovered precrisis sales levels.
Economic conditions all over the U.S. have improved to the point where people are less likely to move to the Lone Star State for monetary or employment reasons, but that doesn’t mean the Texas housing market is struggling. It may just be that other states’ economies and housing markets are improving.
____________________
About the Data
All monthly data used in this study are seasonally adjusted. All national and state sales data include only existing single-family homes sold except for New York, which includes existing townhomes and condominiums. Arizona housing data are estimated. California housing data were provided by the California Association of Realtors. Pre-February 2014 Colorado housing sales and median home price data are estimated. February 2014 data and on were provided by the Colorado Association of Realtors. Pre-2008 Florida housing sales and median home price data were estimated. Post-2008 data were provided by the Florida Realtors Research Department. New York housing data were provided by the New York State Association of Realtors. Washington housing data from Washington Center for Real Estate Research at the University of Washington were converted from quarterly to monthly frequency using the Chow-Lin method.
The Federal Housing Finance Agency (FHFA) House Price Index measures the general movement of single-family home prices. Comparing the reported FHFA price index to an estimated value based on housing market fundamentals (change in population and nonfarm employment, mortgage rate, unemployment rate, income per capita, and housing starts) might reveal whether there is a misalignment in prices. The methodology used to attain the estimated FHFA house price indices is the same used by Case-Shiller in 2003 and the Real Estate Center’s article “Is Something Wrong with Texas Home Prices?" (online atrecenter.tamu.edu). If the actual FHFA price index value is greater (lower) than the estimated index, then prices are growing at a higher (lower) rate than what is supported by the state’s market fundamentals, indicating possible issues in the housing market. In the long-run, over-estimated or under-estimated home prices should revert toward fundamentals.
____________________
Dr. Torres ([email protected]) is a research economist and Silva ([email protected]) a research associate with the Real Estate Center at Texas A&M University.
You might also like

TG Magazine
Check out the latest issue of our flagship publication.