


Selling Season


 Home sales activity in Texas tends to accelerate beginning in March, peaks in summer, and troughs in winter (Figures 1 and 2). Monthly shares of annual homes sold in Texas from 1990 to 2015 as well as the seasonal variations of monthly shares over a year measured by the standard deviations of monthly shares are shown in Table 1.


From 1991 to 2015, with the exception of 2008, January was the trough month in home sales activity, on average accounting for 5.5 percent of annual homes sold in Texas. June was the peak month for 13 years, while July and August were peak months in six and five years, respectively. The month of May was peak in 2002 and 2010. On average, June was the seasonal peak month for the entire period from 1990 to 2015.
The seasonal pattern in the state’s housing market was disturbed by the Great Recession and its recovery. November became the trough month in 2008 while in 2010 sales peaked in May and had the largest seasonal variation.
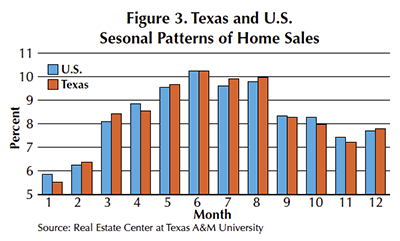
Comparing the seasonal patterns of homes sold in Texas and the U.S., June is the peak month, accounting for 10.2 percent of homes sold in both the state and the nation (Figure 3). On average, the monthly shares of homes sold in Texas have been higher than the nation’s shares in February, March, May, July, August, and December, and lower in January, April, and September through November.
Seasonal Patterns in Texas Metros
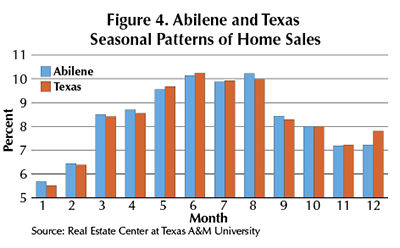
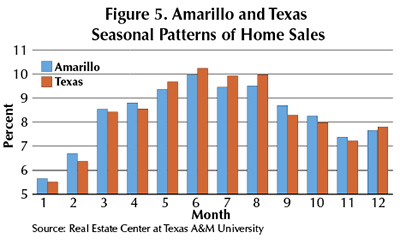
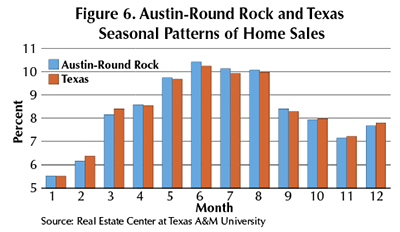
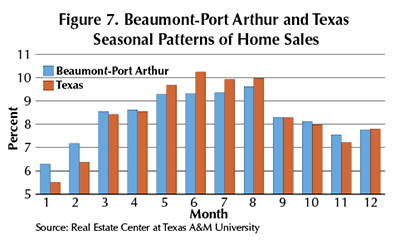
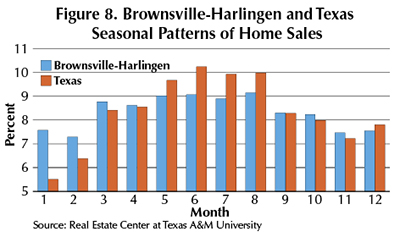
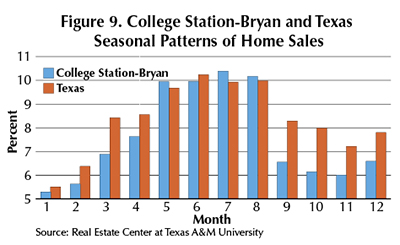
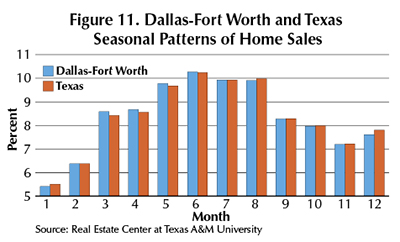
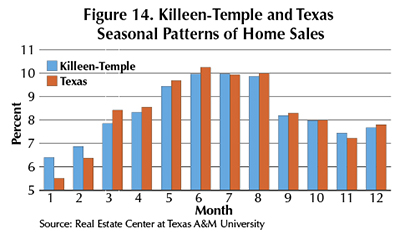
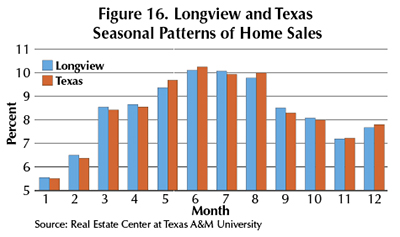
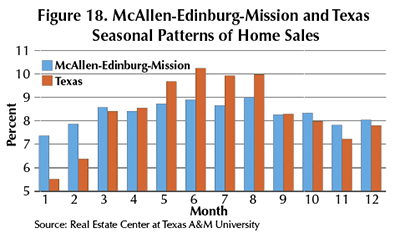
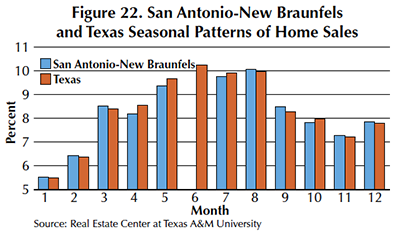
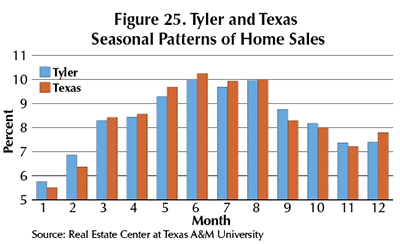
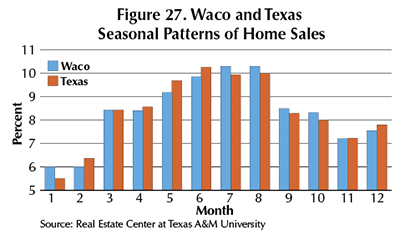
Using monthly and annual home sales data for 25 metropolitan areas of Texas, Table 2 shows the average monthly shares of annual homes sold in the state’s metro areas and their corresponding seasonal variations. On average, January has been the trough month for all the state’s metro areas except Brownsville-Harlingen, El Paso, and Texarkana, which hit their troughs in February. June was the peak month for homes sold in 15 metropolitan areas. The Victoria metro area peaked in May while home sales for College Station-Bryan, Killeen-Temple, and Waco peaked in July and Abilene, Beaumont-Port Arthur, Brownsville-Harlingen, McAllen-Edinburg-Mission, San Angelo, and Sherman-Denison peaked in August.

Monthly home sales variation has been highest in College Station-Bryan (3.27) and lowest in McAllen-Edinburg-Mission (0.49). College Station-Bryan had the lowest share of monthly sales (4.48 percent) in January and highest share of homes sold in July (13.01 percent) among the state’s metro areas as well as the largest variation because of the impact Texas A&M University’s calendar and university employment have on home sales.
Figures 4 through 28 compare the seasonal patterns of home sales in the Texas metropolitan areas with the state’s overall seasonal pattern.
Causes of Seasonal Patterns
Several factors are behind the seasonal patterns in home sales. The most important ones are school calendars, holidays, weather, and jobs in the education industry. Families need to move to their desired school districts before the beginning of the school year in September.
Therefore, home sellers put their homes on the market before the school year ends to allow plenty of time to complete the sale of their homes as well as the purchases of the homes they are moving to. Employment in the education services industry normally peaks before September and also has significant impact on homebuying and selling activities.
Benefits of Understanding Seasonal Patterns
Understanding seasonal patterns in local housing markets can help homebuyers, home sellers, real estate agents, financial institutions providing mortgages, and all parties involved in housing markets to plan and optimize their housing transactions. For home sellers, the likelihood of selling their homes is greater if they put their homes on the market well before their area’s peak month. For home buyers, there are more homes available to choose in early summer. Sales agents can optimize employing sales assistants and manage their resources consistent with seasonal home sales patterns. A knowledge of seasonal patterns of home sales can help financial institutions to plan their lending activities.


Research Methodology
ThisarticlereportsthefindingsofaresearchprogramattheRealEstateCenteratTexasA&MUniversityonseasonalpatternsinthetimeseriesofmonthlyhomesalesinTexasandthestate’smetropolitanareas.Theresearchfindsrelativelystableandrecurringpatternsofseasonalityinhomessoldfrom1990through2015.TheresearchprojectalsoestimatedandquantifiedseasonalpatternsintheTexashomesalesdatatobeusedforforecastingandplanninghomesalestransactionsbyhomebuyers,homesellers,realestatesalesagents,andfinancialinstitutions.ThetimeseriesdatausedfortheresearchweremonthlyhomessoldinTexasanditsmetropolitanareasfromJanuary1990toDecember2015(compiledbytheRealEstateCenter)andU.S.homesalesdata.
Timeseriesofhomessold,likemanyothereconomicorfinancialindicators,aremadeupoffourcomponents:seculartrends,businesscycles,seasonalpatterns,andrandomevents.Seculartrendsarelong-termupwardordownwardtrendsintimeseriesmainlyduetolong-termtrendsinpopulation,aggregateoutputs,andincomes.Businesscyclesarefluctuationsineconomicindicatorsoverseveralyearscomprisingperiodsofcontractionandexpansion.Seasonalpatternsarethedependenceofthemagnitudesofeconomicorfinancialindicatorsonthetimewithintheyear.Randomeventsareunexpectedorunpredictableeventsthataffectperformanceindicators.
ThetimeseriesofmonthlyhomesalesinTexas(Figure1)comprisesfourcomponents:seculartrends,businesscycles,seasonalpatterns,andrandomshocks.Theseculartrendisdisplayedbyagenerallong-termupwardtrendbecauseofgrowingpopulationandincomesinTexas.ThebusinesscyclecomponentisespeciallyvisibleduringtheGreatRecessionof2008–09andduringrecovery.Thestate’seconomyandthetimeseriesofhomessoldexperiencedseveralrandomshocksmainlyrelatedtooilprices.ThemostnotableonesoccurredwhenthepriceperbarrelofWestTexasIntermediatecrudeoilclimbedtomorethan$120in2008andcollapsedtolessthan$50in2009.Ineveryyearfrom1990to2015,thetimeseriesofhomessolddisplaysseasonalpatternswithpeaksinsummerandtroughsinwinter.
Dividingmonthlyhomesalesforeachyearbytotalhomessoldthatyearandmultiplyingby100removestheseculartrends,businesscycles,andtheimpactsofrandomshocksonthenumberofhomessoldandisolatestheseasonalitypatternintermsofmonthlysharesofannualhomessold(Figure2).
____________________
Dr. Anari ([email protected]) is a research economist with the Real Estate Center at Texas A&M University.
You might also like

TG Magazine
Check out the latest issue of our flagship publication.