


Return to Normalcy?


The Takeaway The Texas housing market is still feeling the effects of the COVID-19 pandemic, but indicators such as an increase in listings of existing homes suggest a return to normalcy. |
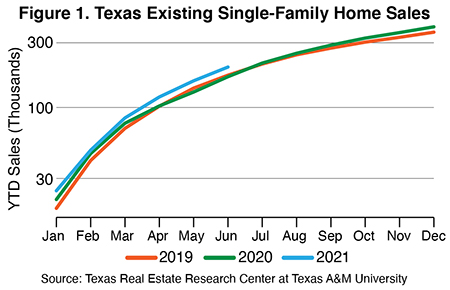
The 2021 housing season is almost over, and the year-to-year comparisons are in full swing. However, sizing up this year against last year may not be as helpful as usual for projecting what’s ahead. Home sales from the first half of 2020 were heavily influenced by the one-and-a-half-month shutdown during part of March and all of April. Comparing 2021 to two years ago, meanwhile, reveals year-to-date sales currently have an almost 25,000-unit lead over 2019’s then record-setting year.
 The second half of 2021 will likely look completely different from 2020’s second half. Sales ramped up during summer 2020 and didn’t let up in the fall like in other years. For that reason, topping last year’s July and August numbers is far from certain even though June 2021 sales were 7 percent higher than June 2020 sales.
The Listings Gap
One sign of this is pending listings. Going into July, they were down around 8 percent, a significant gap that may be too much to overcome. Still, given the strong housing activity so far, year-end sales figures should be nothing to shrug at even if they fall short of 2020 (Figure 1).
The improvement in housing inventory bodes well for sales this year. The statewide month’s inventory level may have bottomed out in May at 1.3 months, but then it improved to almost 1.4 months in June. Although small, it’s a change in the right direction.
The turnaround in inventory has been fueled by a bounceback in new listings (the flow of new homes into the market), which more closely resembled 2019 than 2020 (Figure 2). Still, there is a significant gap in the number of active listings (current level of homes on the market) between 2021 and previous years. The June 2021 count of statewide active listings was close to 50,000, compared with 85,000 the year before. Until that gap narrows, the pressure on home prices will likely continue.

A New Phenomenon Emerges
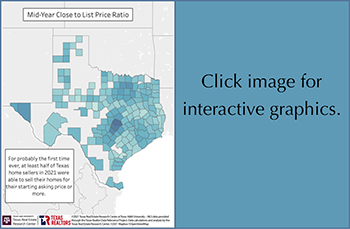
Home price appreciation is currently through the roof. According to the Texas Real Estate Research Center’s Home Price Index, the statewide index grew 13 percent year-over-year in second quarter 2021. The rapid growth has resulted in a new phenomenon in the market. For probably the first time ever, at least half of Texas home sellers this year were able to sell their homes for their starting asking price or more (see table). To put that into perspective, in 2019 only around a quarter of Texas sellers received at least their asking price. Before that, the highest rate was in 2015, and even that was below 30 percent.
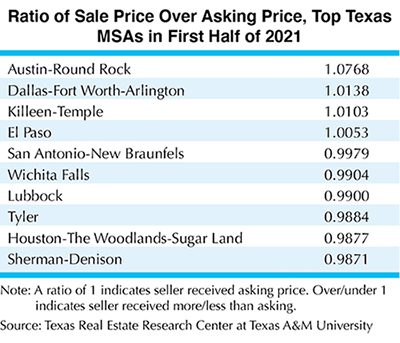
Sellers currently have a remarkable amount of control over the market. Aggressive bidding wars in markets such as Austin and Dallas are not new, but other markets have recently experienced intense buyer skirmishes that would have turned heads two years ago. Markets such as Killeen-Temple have benefited from their strategic location within the Texas Triangle (the region between Houston, San Antonio, and DFW) and proximity to Austin, while cities such as El Paso and Lubbock show home price growth is reaching even the more remote markets.
Construction Shakeup
The new-home market also had a bit of a shakeup last year as a result of the COVID shelter-in-place mandates. Comprehensive data from the U.S. Census Bureau’s Survey of Construction reveal just how wild 2020 was for homebuilders.
Texas accounted for 81.6 percent of total single-family permits in 2020. In addition, the same year brought a massive spike in new single-family detached home sales for the West South Central region, which includes Texas and neighboring states such as Oklahoma, Arkansas, and Louisiana. Between 2019 and 2020, new-home sales increased nearly 25 percent, totaling 148,000 new homes in the region.
Like existing-home sales, new-home sales began to escalate over the summer and extended throughout the remainder of the year. The last time Texas had sales of this magnitude was just before the mid-2000s housing crash. However, despite hot demand in 2020, new-home sales didn’t surpass the 169,000 homes sold in all of 2006 (Figure 3).

The massive jump in sales put the new-home market to the test. Combined with labor and material shortages, the industry has had its work cut out to fulfill orders in a timely fashion. On paper, most spec homebuilders (those who build homes without a sales contract in place) in 2020 maintained a start-to-finish building window of six months, comparable to the pre-COVID market. The timeframe in southern states, including Texas, was closer to five months. However, this trend clearly doesn’t square up with what’s going on right now. What happened?
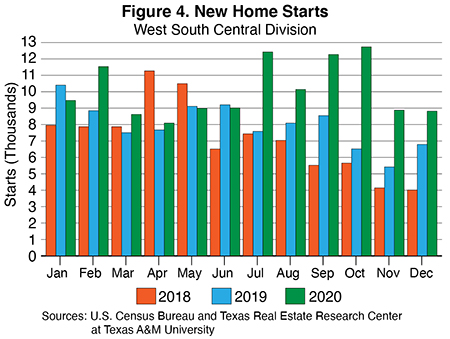
New homes uncharacteristically broke ground later and later into 2020, creating a massive backlog. November and December of 2018 each had 4,000 new-home starts. In the same months of 2020 that number was closer to 9,000 (Figure 4). Because of that, the Census Bureau’s Survey of Construction will likely show 2021 was the year that revealed market strain on output. Additionally, while spec homes overall turned around quickly, custom homes did not because of increasing labor and supply shortages.
Price pressure, on the other hand,
did show up in the 2020 data. Between 2019 and 2020, the average price of a new single-family home rose $21,000, or 6 percent, to $337,000. The price-per-square-foot increased more than 5 percent to $130. On the surface, 2020’s average lot price did not change from $56,000, but lot sizes got smaller as the year progressed, which explains why lot price per square foot increased from $7.80 to $8.09 in 2020. During the 2006 housing boom, lots were around $4 per square foot.
While prices increased according to the Survey of Construction’s 2020 sample, the magnitude was muted compared with prices in the existing-home market. A more frequently updated Census Bureau series, the Construction Price Index, reveals a national price surge comparable to the existing-home market starting in third quarter 2020 and persisting into first quarter 2021 (Figure 5).

Signs of Normalcy
The Texas housing market is still caught up in the initial impact of the COVID-19 pandemic, but signs of normalcy are emerging, even if minimal. New listings in the existing-home market are returning in numbers similar to 2019. If the latter half of 2021 cools like in most years, that should help recharge housing inventory levels and provide some relief to housing.
The new-home market saw a similar price surge that started in the second half of 2020. At this point, it’s difficult to tell when the supply side of this market will sort itself out. The construction business has many moving parts, including input costs and labor, to name just a couple.
On the demand side, overall optimism among builders is still high according to the National Association of Homebuilders. Judging by the record pace of single-family building permits in 2021—25,000 more than mid-year 2019 and mid-year 2020—it will be awhile before that sector cools off.
____________________
Roberson ([email protected]) is a senior data analyst with the Texas Real Estate Research Center at Texas A&M University.
You might also like

TG Magazine
Check out the latest issue of our flagship publication.