


Payback Predicament
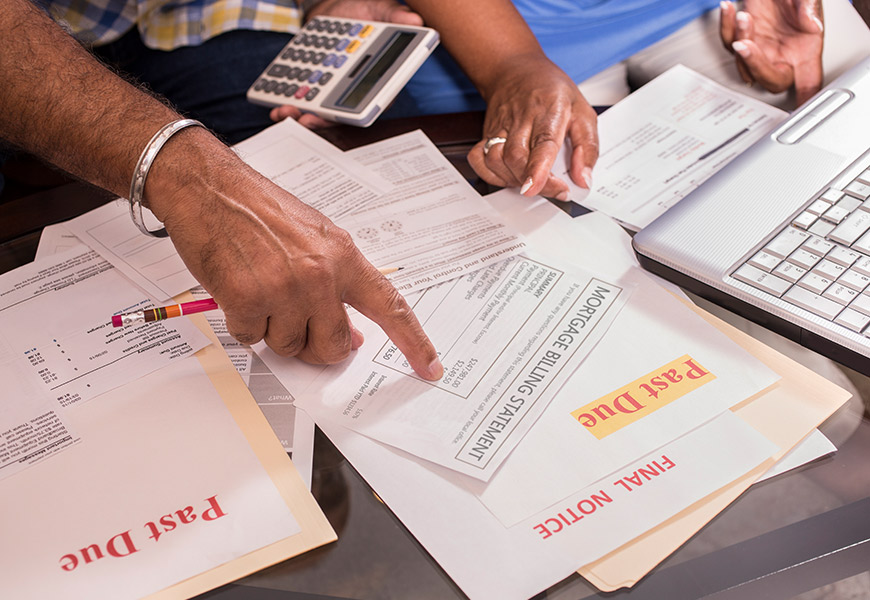

Homeowners who qualified for temporary relief from mortgage payments in the wake of the COVID-19 recession will eventually have to repay any missed or reduced payments. Their ability to do so is largely a function of their age and length of time working. |
Economic downturns indicate significant turmoil in the labor market, often resulting in rises in unemployment and accompanying losses in household income. This threatens consumers’ ability to afford even necessary expenditures, including monthly mortgage payments.
The COVID-19 recession was no exception. In the initial wake of the pandemic, the national mortgage delinquency rate surged to nearly 10 percent but has since declined considerably, largely due to the federal government’s broad-reaching mortgage forbearance program. An estimated 70 percent of existing homeowners qualify for temporary relief in their mortgage payments.
Although mortgage forbearance largely prevents massive mortgage default and foreclosure, a loss in income can significantly affect a borrower’s ability to repay his mortgage.
Maintaining Homeownership During COVID-19
Housing affordability generally falls into two categories: purchase or repayment affordability. Federal housing policy predominately aims to facilitate purchase affordability—a household’s ability to buy a home. Such policy is largely predicated on the perceived financial and social benefits of homeownership (i.e., wealth accumulation and neighborhood stability). Repayment affordability, on the other hand, denotes an existing homeowner’s ability to maintain monthly mortgage payments. As unemployment spikes during economic downturns, spurring potentially substantial declines in household income, federal housing policy largely shifts to facilitating repayment affordability.
COVID-19, which completely upended the nation’s labor market, resulted in massive losses in jobs and income/wages, leaving millions of American homeowners unable to afford their monthly mortgage payments. Anticipating massive mortgage defaults and foreclosures, the federal government extended, through the Coronavirus Aid, Relief, and Economic Security (CARES) Act, a mortgage payment forbearance option to all borrowers who either experienced a financial hardship due to COVID-19 or have a federally-backed mortgage (i.e., HUD/FHA, VA, USDA, Fannie Mae, or Freddie Mac loans). For borrowers with HUD/FHA, VA, or USDA loans, the deadline to apply for mortgage forbearance was Sept. 30, 2021. There is currently no application deadline for borrowers with loans backed by Fannie Mae or Freddie Mac.
Mortgage forbearance allows the borrower topause or decrease their monthly mortgage payments for a set amount of time. In the instance of the CARES Act, homeowners enter forbearance for an initial period of 180 days, but they may extend it by another 180 days or up to 18 months in total. However, borrowers will still be obligated to repay the missed or reduced payments. More information on the mortgage forbearance provided under the CARES Act is on the
Consumer Financial Protection Bureau’s website.
What Affects Repayment Affordability?
Mortgage financing plays a crucial role in a household’s ability to both attain and maintain homeownership. In 2020, 87 percent of U.S. households used mortgage financing to purchase a home. Because of the general structure of a mortgage loan—30-year, fully-amortizing, fixed-rate—the average borrower can expect to make constant monthly payments over three decades.
Income, wealth, and credit—as measured through the debt-to-income (DTI) ratio, loan-to-value (LTV) ratio, and credit score—primarily determine purchase affordability. Repayment affordability is largely a function of income and/or wealth, but it depends heavily on the borrower’s age and tenure in the labor force. Income is a more important indicator of repayment affordability among younger borrowers, who tend to have less wealth, while wealth is more important among older borrowers, who tend to have more wealth but are perhaps no longer working.
The DTI ratio represents the proportion of household income devoted to total household debt payments, including credit card, student loan, auto, and mortgage debt. For example, a DTI ratio of 25 percent indicates that one-quarter of a household’s income goes toward total household debt payments. Younger borrowers, who generally have less income, wealth, and credit than older borrowers, tend to receive loans with higher DTI and LTV ratios. On average, DTI ratios measure lower for conventional loans and higher for FHA and VA loans. In 2020, the average DTI ratio for FHA loans—originated primarily to first-time and low-income homebuyers—was 43 percent.
The correlation between the maximum home price affordable to a particular household and the corresponding DTI ratio differs between purchase and repayment affordability. All other conditions remaining the same, the DTI ratio is generally positively correlated with purchase affordability but negatively correlated with repayment affordability. Higher DTI ratios allow for higher monthly mortgage payments, translating into a higher maximum affordable home price and thereby easing purchase affordability. However, the DTI ratio generally bears a negative association to the borrower’s ability to repay his mortgage. A higher DTI ratio dictates a greater proportion of the borrower’s income be devoted to the monthly mortgage payment. As such, a decline in household income is more likely to diminish the ability of a household with a higher DTI ratio to continue to make monthly mortgage payments. For more information on the relationship between the DTI ratio and home price affordable to a borrower, see "Downsized: Pandemic Diminishes Homebuying Ability."
Effects of Household Income Loss on Repayment Affordability
Total monthly mortgage payment is shown as a function of the borrower’s income and the DTI ratio in Table 1. Payment increases as the DTI ratio increases. For example, a borrower earning $50,000 annually can afford a total monthly mortgage payment of $833 with a DTI ratio of 20 percent, but $2,083 with a DTI ratio of 50 percent.
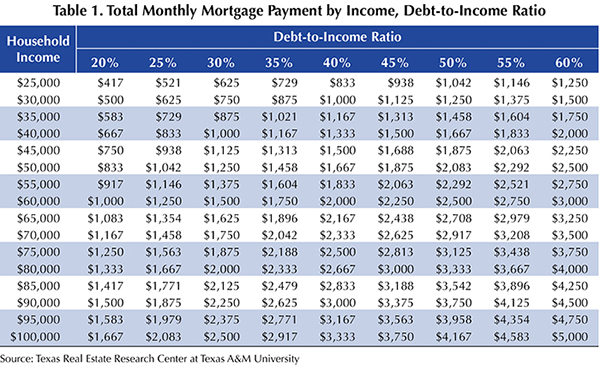
While a higher DTI ratio eases purchase affordability, providing the borrower access to a higher-priced home, it erodes the monthly residual income (Table 2).

For a borrower earning $50,000 annually, the monthly residual income amounts to $3,333 at a DTI ratio of 20 percent and $2,083 at a DTI ratio of 50 percent. In other words, the amount remaining to cover additional necessary expenses—food, clothing, transportation, health care, etc.—decreases as the DTI ratio increases. Borrowers with higher incomes generally have higher residual incomes.
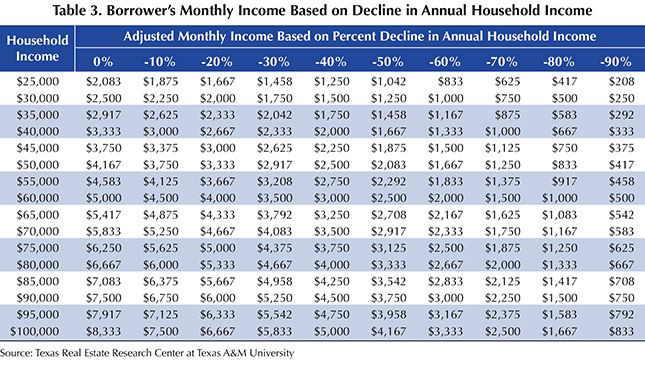
A borrower’s monthly income based on percent declines in annual household income is shown in Table 3. For example, if a borrower’s $25,000 annual household income declined by 50 percent, his monthly income would drop from $2,083 to $1,042.
According to the Congressional Research Service, a higher proportion of lower-income households saw employment income drop during the pandemic. Nearly two-thirds (65 percent) of households that have children under 18 and that earn less than $25,000 reported losses in employment income, compared with less than one-third (30 percent) of those earning $200,000 or more.
Households facing unemployment and/or a reduction in wages or income are more likely to tap into savings to cover necessary expenditures. While households typically invest in a variety of assets, including retirement accounts, stocks, bonds, and real estate, a savings account is the most liquid source of wealth. According to the Survey of Consumer Finances, the median value of savings accounts of U.S. households in 2019 was $5,300. However, this value varied considerably by the householder’s age. Younger householders had less savings than older householders. The median value of savings accounts of householders younger than 35 was $3,200. Of householders at least 75 years of age, it was $9,300.
The number of months a borrower could maintain the monthly mortgage payment depends on his savings balance, income, and DTI ratio. Tables 4, 5, and 6 compute the number of months based on savings of $1,000, $5,000, and $10,000, respectively. These tables assume the borrower loses all income and does not dip into other sources of wealth, such as gifts from family or friends or his retirement account. However, the structure of the computation is such that any individual value (i.e., $1,000, $5,000, or $10,000) could denote either that entire amount in savings or, for instance, $500 in residual income and $500 in savings for a total of $1,000. Additionally, although the computation assumes the borrower loses all income, the results reflect repayment affordability for borrowers of varying income as the monthly mortgage payment itself is a function of the borrower’s income.
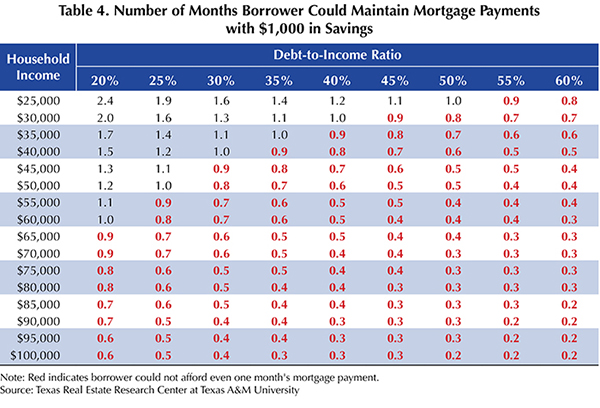
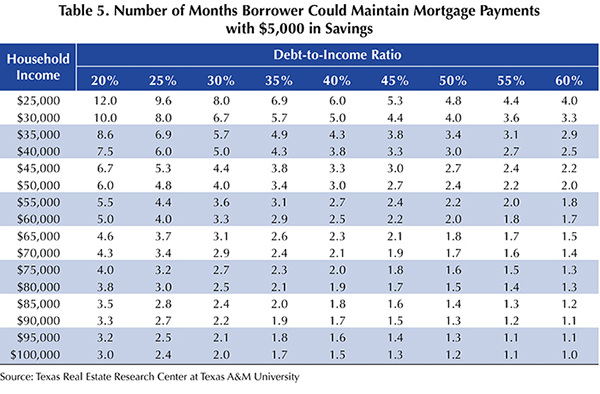

Obviously, borrowers with less in savings cannot maintain monthly mortgage payments for as long as borrowers with more in savings. The majority of borrowers with $1,000 in savings could not afford to make even a single monthly mortgage payment (as depicted in red in Table 4). Borrowers with lower DTI ratios fare better than borrowers with higher DTI ratios, regardless of the savings balance. For instance, a borrower with $5,000 in savings who makes $25,000 could afford to finance his mortgage for 12 months with a DTI ratio of 20 percent, but for only four months with a DTI ratio of 50 percent (Table 5).
The precipitous spike in unemployment or a reduction in hours or income/wages in the wake of the COVID-19 pandemic left millions of homeowners unable to maintain monthly mortgage payments. According to the U.S. Census Bureau, 14.1 percent of Texas homeowners were behind on their mortgage payments in the initial wake of the pandemic. By September 2021, that number had dropped to 12.5 percent.
The mortgage forbearance program enacted by the CARES Act (which includes over $840 million in relief funds to Texas homeowners through the Texas Department of Housing and Community Affairs) considerably diminishes the potential for widespread mortgage default and foreclosure. However, understanding the effects of declines in income on repayment affordability remains a salient topic for consumers, professionals, and policymakers.
____________________
Dr. Losey ([email protected]) is an assistant research economist with the Texas Real Estate Research Center at Texas A&M University.
You might also like

TG Magazine
Check out the latest issue of our flagship publication.