


On the Rise Again

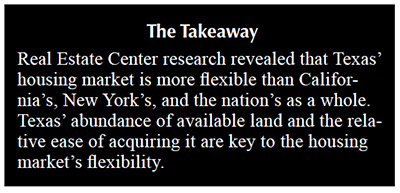 The supply side of Texas’ housing market is more flexible than the nation’s as well as California’s and New York’s. Currently, the state’s housing supply is in the growing phase of a construction cycle that began after the recovery from the Great Recession of 2007–09.
The Real Estate Center researched housing starts data from 1970 to 2015 to study the supply side of Texas housing markets. Housing starts are one of the leading economic indicators for local economies because buying a new house normally boosts consumer expenditures on appliances, furniture, and other home-related items.
Texas and U.S. Housing Starts History and Cycles
Time series of housing starts for both the United States and Texas reveal several common features (Figure 1). First, housing starts for both the U.S. and Texas have proceeded in cycles of expansion followed by contraction. Second, no two housing start cycles were quite the same in duration or amplitude. Third, the supply sides of the Texas and U.S. housing markets experienced five cycles since 1970. Finally, although there is some comovement between Texas and U.S. home starts, the correlation is not strong.
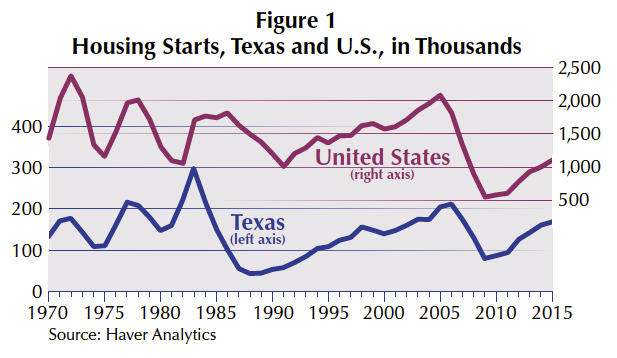
The first Texas housing construction cycle reached a peak of 177,000 housing units in 1972 and ended in a trough of 108,400 in 1974. This cycle coincided with a U.S. housing construction cycle that peaked at 2,360,750 housing units in 1972. The second Texas housing construction cycle began in 1975 and lasted five years. It reached a peak of 217,000 units in 1977 and ended in a trough of 147,590 in 1980. The corresponding cycle for the nation lasted seven years, from 1975 to 1982, and reached a high of more than two million housing units in 1978.
Oil prices as high as $40 per barrel fueled Texas’ third housing construction cycle, which began in 1981 and peaked at 298,550 housing units in 1983. After that, oil prices collapsed, causing housing construction to fall by 85 percent to a trough of 42,250 units in 1988. This time the nation’s housing construction cycle lasted nine years, from 1982 to 1991, and reached a peak of 1,812,000 units in 1986.
From 1989 the supply side of the state’s housing market began its fourth housing starts cycle, characterized by a long and slow upward trend. The cycle reached a peak of 212,000 units in 2006, just before the onslaught of the Great Recession, but was still lower than the all-time high of 298,550 in the previous cycle.
During the Great Recession, the state’s housing construction fell 62.5 percent to 79,550 in 2009. The nation’s fourth housing construction cycle began in 1991, reached a peak of 2,072,900 units in 2005, then fell 73.3 percent to 554,000 units in the Great Recession. Since 2010, the housing markets of both the U.S. and Texas have been recovering from the Great Recession and currently are in the expansion phase of their fifth housing starts cycle (Figure 1).
The contrast between the gradual upward trend in the state’s housing construction in the fourth cycle (1989–2006) compared with the oil price driven boom-bust of the third cycle (1981–88) suggests that the state’s building industry may have learned an important lesson: not to get carried away by ups and downs of oil prices in the short run and instead focus on the long-term relationships between housing demand and population growth.
Housing Supply Flexibility
Population is the single most important determinant of demand for housing units given that all people need shelter. As population grows in a region, the region’s housing market must be able to supply more housing units; otherwise, higher housing demand leads to higher home prices.
One measure of housing supply flexibility for a region is the number of new housing units per thousand people (Figure 2). Comparing Texas with the U.S. reveals that there were three distinct periods of relative housing supply flexibility. New housing units per 1,000 people in Texas exceeded that of the nation from 1970 to 1985, reaching an all-time peak of 19 in 1983 compared with 7.3 for the U.S. in the same year. From 1986 to 1994 the state’s number of new homes per 1,000 people lagged that of the nation and fell to a trough of 2.5 in 1988 compared with six for the U.S.

Since 1995 the Texas housing market has been able to supply more new homes per 1,000 people compared with the national average, reaching a pre-Great Recession peak of 9.1 in 2006. The pre-Great Recession peak of seven for the U.S. occurred one year earlier in 2005. This metric fell to 3.2 for Texas and 1.8 for the U.S. during the Great Recession. Since the U.S. economy recovered from the Great Recession, numbers of new housing units for both the nation and Texas have been rising, but Texas has managed to produce more new housing units per 1,000 people (Figure 2).
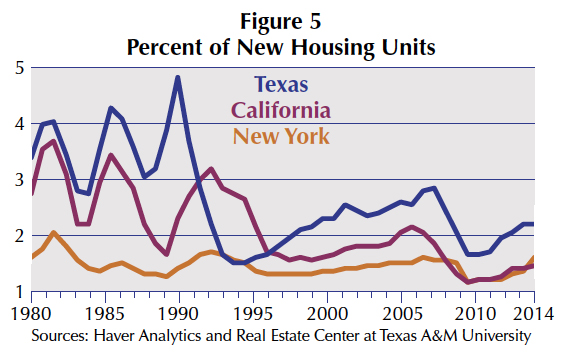
Another metric of the flexibility of housing supply is the share of total housing units accounted for by new housing units. This metric indicates the ability of the supply side of a region’s housing market to add new homes or replace older homes. The higher the percentage of new housing units in housing stocks, the shorter the time to replace older homes. Comparing Texas with the U.S., there were three distinct periods of relative housing supply flexibility measured in terms of the share of new housing units (Figure 3). Texas’ share exceeded that of the nation until 1985 and reached an all-time peak of 4.9 percent in 1983 compared with 1.9 percent for the U.S. in the same year. From 1986 to 1994, the state’s share of new homes lagged behind that of the nation and fell to a trough of 0.6 percent in 1988 compared with 1.5 percent for the U.S.
Since 1994 the share of new housing units in Texas has exceeded the corresponding share for the nation, reaching a pre-Great Recession peak of 2.3 percent in 2006. The pre-Great Recession peak of 1.7 percent for the U.S. occurred one year earlier, in 2005. During the Great Recession, this metric fell to 0.8 percent for Texas and 0.4 percent for the U.S. Since the U.S. economy’s recovery from the Great Recession, the percentages of new housing units for both the nation and Texas have been rising, but Texas has managed to attain higher shares of new homes (Figure 3).

Texas vs. California and New York
Since 1992, the number of new housing units per 1,000 people for Texas has exceeded those for California and New York (Figure 4). Since the post-Great Recession recovery, the gaps between the number of new housing units for Texas and the other two states have been widening, showing the higher flexibility of the supply side of the Texas housing market. These findings are also supported by the shares of new homes in total housing stocks for Texas, California, and New York (Figure 5).

Housing Supply Flexibility and Home Prices
The outcome of higher flexibility of the supply side of the Texas housing market is a mild long-term upward trend in Texas average home prices, mainly due to the general level of inflation as shown by home price indexes of the Federal Housing Finance Agency (Figure 6). Texas’ housing market has been able to respond to higher demand for housing units by supplying more homes while short-run supply and demand imbalances have generated wild fluctuations in home prices in California and New York (Figure 6).

The relative ease of Texas’ land acquisition process and abundant supplies of land have been important factors contributing to the flexibility of the state’s housing supply, reducing the risk of a home price bubble followed by a major home price collapse. But the housing supply flexibility has brought the risk of a housing supply bubble, which may be avoided in the current phase of the state’s housing supply as long as the state’s building industry has not forgotten the painful lessons learned in the turbulent 1980s.
____________________
Dr. Anari ([email protected]) is a research economist with the Real Estate Center at Texas A&M University.
You might also like

TG Magazine
Check out the latest issue of our flagship publication.