


Oil’s Impact on Midland and Odessa Housing


Located in the heart of the Permian Basin, Midland and Odessa are ground zero for the latest downturn in upstream oil and gas (O&G) activity. About one in five jobs in the region are directly related to O&G, the highest percentage in the country.
When indirect jobs dependent on the industry are factored in, it is not surprising that so much attention is being paid to any signs of economic distress in the two cities. However, this is not their first rodeo when it comes to oil busts, and many locals still remember the lessons learned during the 1980s downturn.
Correctly predicting future crude prices and their potential impact on the Permian’s O&G industry in the months ahead is impossible. But a look at oil’s effect on Midland’s and Odessa’s employment and housing markets during the last five years does offer an interesting snapshot of the latest boom/bust cycle’s influence on the region through 2015.

Roller Coaster Ride for Crude and Rig Count
Although unconventional drilling methods that combine hydraulic fracturing with horizontal drilling have been in use since the 1980s, the real run-up in unconventional drilling began around 2011. Part of the reason for the increase was a strong crude price.
The monthly average price of West Texas Intermediate (WTI) crude registered above $100 a barrel for at least three months in the four years since 2011, according to the federal government’s Energy Information Administration (EIA). April 2011 marked the peak average price of $110 while 2014 recorded the most months above $100 at six.
Crude price began a fairly rapid descent in October 2014 when Saudi Arabia declined to reduce its production to support it. After a dip into the $40s, crude again rose to plateau briefly at a still low $60 per barrel in June 2015. By year-end 2015, prices had declined well into the $30s.
Rig count in the Permian Basin has been extremely sensitive to the price of crude during this cycle. The Permian rig count began 2011 at about 360 rigs, peaking at a monthly average of 529 during June 2012 based on calculations using Baker Hughes weekly data. By December 2015, rig count had collapsed to 211, a 60 percent decline.
Rig Count’s Impact on Employment
Just as rig count is sensitive to crude price, Midland’s and Odessa’s employment growth is also sensitive to changes in the rig count. The most current local monthly employment data from the U.S. Bureau of Labor Statistics (BLS) are produced at the Metropolitan Statistical Area (MSA) level.
The Odessa MSA consists of Ector County only. The Midland MSA added Martin County to Midland County in 2013. While Midland County’s population exceeds 150,000, Martin County’s population is estimated at less than 6,000. As a result, Midland County dominates the Midland MSA’s statistics.
The Midland and Odessa MSAs began 2011 with a total non-farm employment of 73,000 and 62,900, respectively. By December 2015, employment had increased to 91,700 (+26 percent) and 74,200 (+18 percent), respectively.
The peak in year-over-year employment growth occurred almost simultaneously in both MSAs, reaching 10.5 percent in July 2011 in Midland and 11.2 percent in August 2011 in Odessa. The peaks occurred just months after the April 2011 crude price peak.
The growth rate began to drop noticeably by first quarter 2015 in both MSAs. Total non-farm employment growth from December 2014 to December 2015 registered a negative 7.1 percent for the Midland MSA while Odessa MSA employment growth declined by 9.2 percent.
Index Use for Comparisons
An index has been used to evenly compare the magnitude of changes in variables being discussed, using January 2011 as the starting point or "base." The base value is 100, and the index numbers over time are expressed as a ratio to the base value. For example, if rig count in June 2014 was double its January 2011 level, the index value for that month would be 200.
Crude price, although fairly volatile, continued an upward trend through mid-2014 (Figure 1). During the same period, the Permian Basin rig count was growing at an even faster rate. These increases are reflected in the positive impact on non-farm employment growth observed in both Midland and Odessa.

While the downward momentum in crude prices had begun by mid-2014, rig count held on another five months before it began its slowdown in December. Non-farm employment growth in both MSAs began its decline a month later in January 2015.
Unfortunately, the BLS also combines O&G employment with construction employment in the Midland and Odessa MSA statistics. This limitation makes a pure look at O&G employment impossible. However, mining and logging and construction employment growth in percentage terms far exceeded growth in total non-farm income in both MSAs.
In the Midland MSA, an increase of 7,200 mining and logging and construction jobs was recorded between January 2011 and December 2015, a 41 percent increase.
In the Odessa MSA, the increase was lower—3,500 additional jobs for a 27 percent increase during the same period.
Housing Market Observations
Expanded Real Estate Center data capabilities allow the new and existing housing markets to be examined independently. However, "new" homes are only new construction that has been listed in the local multiple listing service (MLS) systems, and this represents only a limited percentage of new home sales. Other new homes sold in-house by the sales staff of individual builders is not part of the new home analysis.
The bulk of home sales in Midland and Odessa occurs in two counties, Ector County for Odessa and Midland County for Midland. As a result, those two counties are used exclusively for comparison in the following discussion.
The analysis uses monthly data to cover the five-year period between January 2011 and December 2015. Housing statistics also include condos and townhomes.
Midland County Existing Home Sales
A significant drop in existing sales occurred in
the second half of 2014 as rig count declined (Figure 2). Monthly sales
bottomed at 78 in February 2015, the lowest monthly total observed during the
five-year analysis.

A surprisingly strong rebound in sales occurred by mid-2015. July 2015 registered 210 existing sales, the highest monthly total over the analysis period. Sales also ended 2015 on a strong positive trend.
A sharp increase in months inventory coincided with the drop in rig count beginning in late 2014 (Figure 3). The move up began in September 2014 from an extremely low 2.2 months inventory, increasing to a mere 4.0 months by year-end 2015. About 6.5 months inventory is considered to be a balanced market with no advantage to sellers or buyers.

The continued tightness in inventory is also reflected in the lack of any perceptible drop in median closing price or average closing price per square foot by year-end 2015.
Sales price distribution reveals a significant upward migration in existing home sale prices also occurred between 2011 and 2015. The percentage of home sales up to $199K declined while sales between $200K and $999K increased.
Improving incomes related to a more vibrant O&G sector probably contributed heavily to this upward trend. About 73 percent of existing homes sold in 2015 were priced between $150K and $399K.
Ector County Existing Home Sales
Existing home sales in Ector County also dropped
as rig count plunged in late 2014 (Figure 4). However, the decline was not as
deep as in Midland. While 2015 sales actually bottomed at 59 in February, sales
in the same month in 2014 had been even lower at 56.
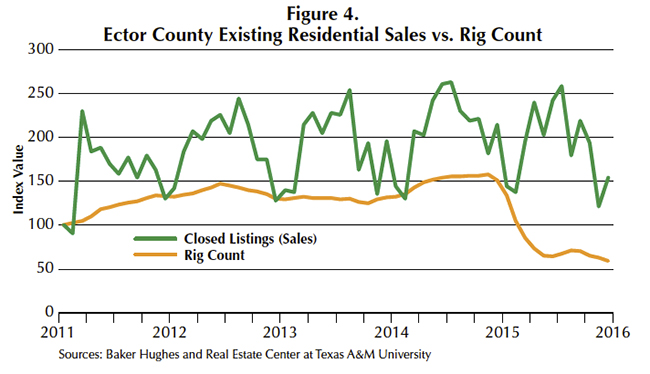
The peak in monthly sales over the analysis period occurred in July 2014 at 113, but July 2015 was only two sales short of that at 111.
Although Ector County’s increase in months inventory occurred later than Midland’s, the rate of increase was much steeper (Figure 5). Ector County ended 2015 with a moderately higher 5.0 months inventory.

Again, owing to the low inventory level, median closing prices and average closing price per square foot remained solid through year-end 2015.
Similar to Midland, Ector County also experienced an upward price migration during the five-year period. A lower percentage of sales occurred between 2011 and 2015 in the bottom price range through $149K. Meanwhile, the percentage of sales increased between $150K and $399K.
The sweet spot of existing sales in 2015 occurred between $100K and $249K, where 71 percent of all sales occurred. This range is noticeably lower than where the bulk of sales occurred in Midland that same year.
Midland County New Home Sales
Single-family building permits are included in
Figure 6 along with new home sales. Strong spikes in issued permits occurred in
July 2014 and June 2015. Peaks in new home
sales also occurred at nearly the same time.
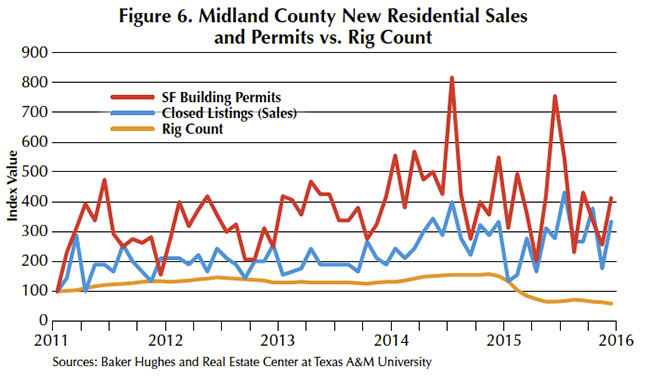
A fairly significant dip in sales occurred in January 2015 as rig count began to decline. However, the sales trend quickly turned up again, ending 2015 in a positive direction. Peak monthly sales for the five-year period topped out at 39 in July 2015.
Months inventory continued to tighten through August 2014 as rig activity increased, bottoming at an extremely low 1.1 months (Figure 7). As rig count went into decline, months inventory again began to move up.

The increase through April 2015 only lifted it slightly to 2.8 months, at which point it again began to fall. As of year-end 2015, no new homes were listed for sale through the local MLS system.
Based on available data, builders appear to have been proactive in shutting down the new inventory pipeline quickly as the O&G sector worsened. This conclusion is supported by the lack of any meaningful downturn in median closing prices and average closing price per square foot through year-end 2015.
The bulk of new home sales in 2015, about 64 percent, occurred in properties priced between $150K and $249K.
Ector County New Home Sales
Similar to Midland, Ector County had two significant spikes in new home permits (Figure 8). However, the spikes occurred much earlier, with the largest registered in June 2013 followed by another three months later in September.

New home sales dipped briefly two times, once in January 2014 and again in January 2015. The second drop coincided with the falloff in rig count. However, both dips were followed by lengthy positive sales trends, with year-end 2015 ending on a solid upward note.
Months inventory has been quite volatile during the analysis period (Figure 9). However, the peak in months inventory that occurred in October 2012 only brought the level to an extremely tight 2.6 months.

Without data on in-house sales by homebuilders, it is difficult to say whether such a low inventory level is truly representative of the market. However, the strength in median closed prices and average closed prices per square foot lends support to an extremely tight new home market.
Just as in Midland County, builders appear to have been quite vigilant with no new homes listed for sale through the local MLS system by year-end 2015.
Sales prices migrated up between 2011 and 2015, primarily from the $100K to $199K range to the $200K to $249K bracket. About 64 percent of new home sales in 2015 were between $150K and $249K, with the real sweet spot occurring between $200K and $249K.
____________________
Dr. Hunt ([email protected]) is a research economist with the Real Estate Center at Texas A&M University.
You might also like

TG Magazine
Check out the latest issue of our flagship publication.