


Magnificent Seven

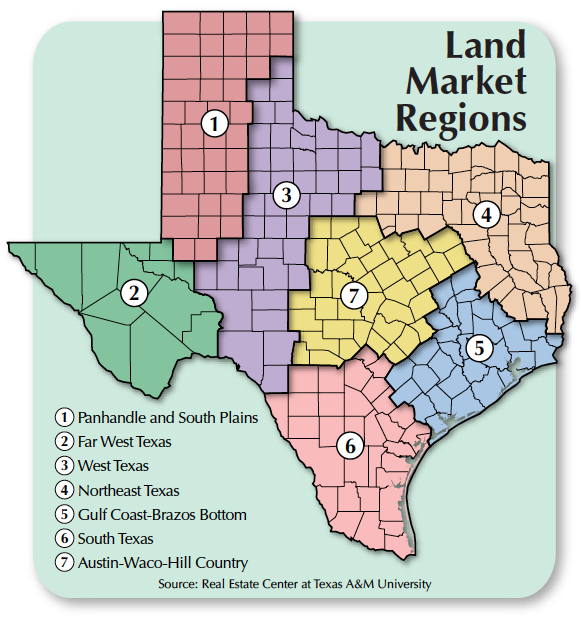
In 2002, the Real Estate Center delineated Texas into seven distinct rural land regions using countywide historical land market data and input from land experts. Focusing on data at the regional rather than statewide level has enabled the Center to more precisely monitor land market trends. |
Texas’ size and vast landscapes make insightful discussions on statewide market trends difficult. Unlike, say, Iowa, where rural land is relatively contiguous in terms of geography and production types, Texas’ rural land is dedicated to many different production types and influenced by numerous nonagricultural factors. As a result, the Real Estate Center conducts its rural land research at a regional level. Studies done at the regional level avoid “washing out" important details and trends that can occur when aggregating at the state level. The regional studies also capture factors tied not only to agricultural production and rural land management but also off-land trends specific to those areas.
In 2002, the Real Estate Center attempted to capture the unique characteristics of Texas land markets by delineating rural land market regions. Countywide assessment of land types and production as well as input from regional land experts determined the seven regions used today. Seventeen years later, the Center can assess the success of the original delineation.
Creating Texas’ Land Regions
Dividing an area into distinct regions proves difficult because one could reasonably argue for making regions bigger or smaller. For instance, areas on a region’s periphery tend to look similar to the surrounding regions, so why not make that region larger? On the other hand, the differences within a region promote the argument of splitting regions even further. Several measures can be used to determine the success of the regions’ delineations.
First, are the regions different enough to justify the boundaries created? A pairwise test performed on the relationships between each of Texas’ seven regions addressed the question of uniqueness. The tests assessed the ability of one region’s price history to explain or predict changes in another region’s prices. Results indicate limited predictive power from one region to another for all possible regional relationships. Most results indicated each region largely explained itself, and including price information from other regions did not improve the predictive nature of the model. These results show historical data from other regions is not statistically relevant and, therefore, the markets are statistically different from each other.
Next, do the regions make sense intuitively to regional land market experts? Most importantly, regional delineation must make intuitive sense to market participants. Several information sources were considered in determining the regions. The Center used historical land market data, including rural land uses and production, and consulted land market experts to create a holistic view of the markets that researchers, due to limited resources, would not fully obtain by using only one source or the other.
Finally, do the regions provide enough data individually to make statements about the regional markets? The database used to make generalizations about regional land trends consists of land sales taking place within each region at a particular point in time. As the number of transactions in the database increases, so does the strength of the generalizations made. Having more transactions also reduces the chance of an obscure transaction skewing a region’s general trends.
The Center’s database has an average of over 2,000 market transactions per region per year (see figure). Some regions average more than 3,000. Only in Region 2 (Far West Texas) do market transactions average fewer than 100 per year. While Region 2’s average is far fewer than other regions, the number of acres per transaction is considerably higher. Given the nature of Region 2 land, the number of transactions is typical for that market.

Variances in Production and Land Use
Texas land market regions, while similar in many regards, vary in production and land use. Production diversity is a product of the varied geography and soil types across the state. Pasture remains the predominant land-use type. Other uses range from timber to cropland. The regions capture these inherent differences to create coherent submarkets.
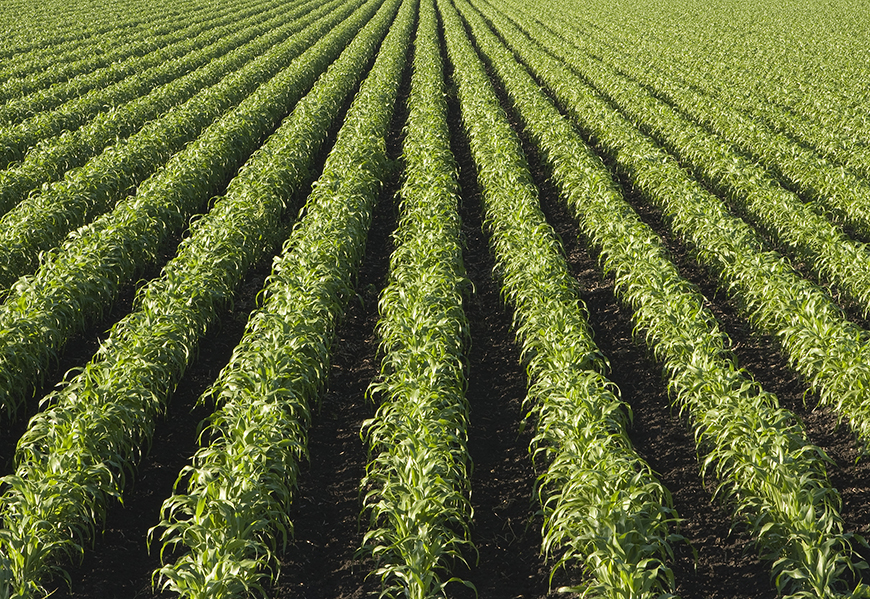
Region 1 (Panhandle and South Plains) is responsible for 48 percent of Texas’ cropland production, the highest concentration in the state. The region also accounts for 66 percent of Texas’ irrigated cropland. While upland cotton and winter wheat are the predominant crops, the region accounts for about two-thirds of the total acreage in Texas dedicated to corn production.
By contrast, Region 2 (Far West Texas) holds about 3 percent of the state’s cropland production. Unlike many other regions, its geography is not suitable for most types of crops, but the region does account for about 20 percent of Texas orchards. Native pasture dominates the rural landscape at 96 percent of rural land use.
Regions 3, 6, and 7 (West Texas, South Texas, and Austin-Waco-Hill Country, respectively) contain about 80 percent of the state’s wildlife management land with Region 3 accounting for about 21 percent. Region 3 is largely native pasture with about 17 percent dedicated to cropland production, predominantly winter wheat and upland cotton. Because about 95 percent of the cropland is dryland production, these less water-intensive crops dominate Region 3.
Region 6, with about 29 percent of the state’s wildlife management acreage, differentiates itself from Regions 3 and 7 by having more acreage dedicated to orchards and sorghum production. It contains about a third of the state’s orchards and grows 42 percent of the state’s sorghum. San Antonio is in the region.
Close to 90 percent of Region 7’s land is used either as pasture or for wildlife management. The region has about a third of the state’s wildlife management land and about a quarter of the state’s orchard acreage, but 80 percent of the land is pasture, 69 percent of which is native pasture. Austin and the region’s scenic landscapes make the region popular for recreational land uses. Timber is grown mainly in Regions 4 and 5 (Northeast Texas and Gulf Coast-Brazos Bottom, respectively), with Region 4 accounting for roughly 83 percent of the state’s timber production. Region 5, meanwhile, is 71 percent pasture and is responsible for 100 percent of the state’s rice production, 66 percent of peanut production, and 63 percent of oat production. Both regions have major metropolitan areas (Dallas in Region 4 and Houston in Region 5), which tend to affect local rural land markets.
Capturing Texas Land Regions’ Inherent Qualities
When regions are established successfully, transaction characteristics such as price per acre and average acreage sold tend to be consistent. While these characteristics don’t align completely, patterns should arise indicating unique markets exist.
For example, as noted, native pasture dominates both Regions 2 and 7, but the transaction characteristics in each region differ substantially. Because of its location and lower land productivity, Region 2 (Far West Texas) generally yields smaller prices per acre and larger tracts per purchase. Land sales for Region 7 (Austin-Waco-Hill Country), however, tend to have smaller acreage sales with larger per-acre prices because the area is optimal for recreational use because of its proximity to metropolitan areas. Last year, the number of acres per sale averaged 6,923 in Region 2 and 218 in Region 7. Similarly, Region 2 land on average sells at a lower price than Region 7 land. Last year, Region 2 land averaged $791 per acre while Region 7 averaged $3,466. The differences in land use and proximity to potential buyers shape the land’s dollar and acre profiles.
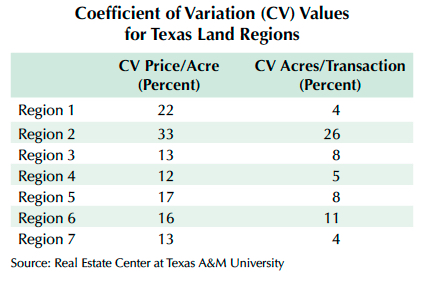
Another way to gauge the consistency of a region’s sales transactions is by looking at the coefficient of variation (CV), which is the standard deviation of the data divided by the mean. The coefficient of variation measures the average variability of a data series relative to its mean. The table shows each region’s CV for both prices paid and number of acres sold in a transaction. Region 2 has the largest CV with 33 percent variation around the mean for price per acre and 26 percent variability in the acres sold per transaction. In other regions, such as Region 4, there is as little as 12 percent variability around the price-per-acre mean and 5 percent variability around the mean acreage sold.
Texas’ rural land submarkets are a result of the state’s size and geographical diversity. According to several measures, the seven land market regions defined by the Center have successfully captured the inherent qualities of each submarket, ensuring greater accuracy in reporting of Texas land market trends.
____________________
Dr. Kiella ([email protected]) is an assistant research scientist with the Real Estate Center at Texas A&M University.
You might also like

TG Magazine
Check out the latest issue of our flagship publication.