


Liquidity of Texas Homes


 Liquidity of an asset is the speed at which it can be exchanged for cash without affecting its market value. Different assets have different degrees or orders of liquidity. It may only take a few minutes to sell stocks and bonds online, but selling an office block may take several months. Money and checking accounts are the most liquid assets followed by bonds and stocks, precious metals, real estate, and works of art.
Liquidity is important for asset owners because in the future they may need to sell the assets. When investors consider a variety of assets, they use a number of metrics to evaluate asset profitability, primarily expected yield and degree of liquidity. Prospective investors base their investment decisions on the rates of return they expect to earn over the holding period, and the ease and quickness of selling them.
Liquidity of assets depends on a number of factors, including relative strength of demand for and supply of assets in any period, costs, complexity, and legal arrangements of transactions.
Liquidity of Real Estate Assets
Real estate properties are the least liquid assets because real estate transactions are complex, costly, time consuming, and require special legal arrangements. In addition, real estate markets face the problem of valuation. That is, until a price is agreed on for a real estate asset, nobody really knows its value in the market. Every real estate property is unique because of its location, features, and other factors. Prospective buyers and sellers of real estate assets and their brokers may use information contained in recent transactions for similar properties to estimate prices, but these are nothing more than informed opinions of value.
Days on Market as Measure of Liquidity
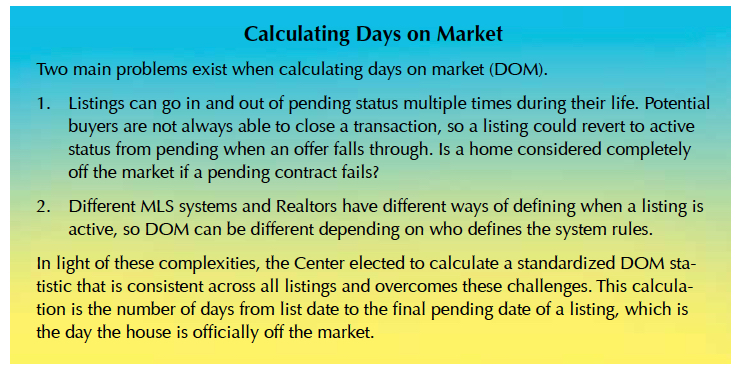
For this analysis, days on market (DOM) is the number of days a real estate property is listed for sale until it enters its final pending period (see Calculating Days on Market). The final pending period that starts on the final pending date of a listing means the home really is off the market.
Average DOM for a regional real estate market provides valuable information for market participants and is an important indicator of regional or local real estate market status. Real estate markets, like other markets, are always in a state of flux based on the relative strengths of the supply and demand sides of the market, which determine prices and quantities of real estate properties available. In any period, higher (lower) demand for real estate properties relative to supplies leads to higher (lower) prices and more (less) quantities of properties sold.
The balance of power in a real estate market during any period continually shifts toward sellers or buyers, resulting in sellers’ or buyers’ markets. Fewer (more) days on market indicate stronger (weaker) demand for real estate assets relative to supplies. Monitoring these trends and changes in average DOM can help sellers and buyers evaluate the status of the market and price properties to be put on the market or revise prices of properties already on the market.
Texas Days on Market
To monitor market liquidity of Texas regional housing markets and 26 metropolitan areas, the Real Estate Center compiled and developed monthly time series of average DOMs from January 2012 to July 2016 using the Multiple Listing Service (MLS) database. DOM was calculated for existing and new residential units sold through an MLS in three submarkets (single family, town house, condominium, and the aggregate of these markets).
Figure 1 presents a time series of DOM for existing single-family homes sold in Texas from January 2012 to July 2016. The time series of DOM, like time series of home sales, displays seasonal patterns, with highs in the first two months of the year and lows in midsummer. It also shows 12-month moving averages of DOM to remove seasonality and uncover long-term trends.

Figure 2 presents moving averages of DOM for existing and new single-family homes sold from January 2012 to July 2016. It shows a long-term downward trend in average DOM for existing single-family homes sold during the Texas economy’s ongoing recovery from the Great Recession. Average DOM for existing single-family homes fell from 89 days in January 2012 to 54 days in December 2015 and then to 53 in July 2016.

Average DOM for new single-family homes fell from 100 days in January 2012 to 85 days in April 2014 but then trended upward to 92 days in July 2016. One caveat when comparing trends in DOM for existing and new homes is that MLS is the source of the data, and not all new homes, townhomes, or condominiums are sold through the MLS. Builders often market and sell their newly built homes directly to buyers.
Average DOM for existing Texas townhomes sharply decreased from 96 days in January 2012 to 57 days in January 2014 and then drifted down to 44 days in July 2016 (Figure 3). Average DOM for new Texas townhomes also sharply decreased from 113 days in January 2012 to 81 days in October 2013 but stabilized in a range between 80 and 90 before falling to 79 days in July 2016 (Figure 3).

Market liquidity trends for existing Texas condominiums have been similar to those for single-family homes and townhomes. Improving liquidity in the condo market has reduced the average DOM from 109 days in January 2012 to 64 in July 2016 (Figure 4). But market liquidity for new condos has been volatile, as shown by the average DOM, which has fluctuated around 90 days since 2013 (Figure 4).

Liquidity of Metro Homes
Texas metropolitan housing markets ranked by liquidity of existing single-family homes sold in July 2016, as measured by average DOM, are shown in Table 1. Dallas-Plano-Irving with an average DOM of 25 days ranked first followed by Fort Worth-Arlington (27 days), Lubbock (29 days), Austin-Round Rock (31 days), and College Station-Bryan (35 days). The table also shows average DOM in July 2015 and changes in average DOM from July 2015 to July 2016.

Table 2 ranks the Texas metropolitan housing markets in terms of the liquidity of new single-family homes sold in July 2016, measured by average DOM. Beaumont-Port Arthur with an average DOM of 49 ranked first followed by Amarillo and Sherman-Denison (52 days each), and Laredo (55 days). As mentioned, these data are from the MLS and not all new homes are sold through the MLS.

What Drives Liquidity?
Center research finds general economic conditions are the main determinant of market liquidity of Texas homes. A scatter diagram of the relationship between unemployment rates and DOM in the state’s regional markets in July 2016 is shown in Figure 5, which shows that the higher the unemployment rate, the longer it takes to sell homes in local housing markets. The correlation coefficient between DOM in the state’s local housing markets and the local unemployment rate as a measure of economic conditions is about 74 percent.

Participants in Texas housing markets can make better informed decisions about pricing real estate properties to be sold by studying DOM trends in their target markets for the best time to buy.
____________________
Dr. Anari ([email protected]) is a research economist and Klassen ([email protected]) a research data scientist with the Real Estate Center at Texas A&M University.
You might also like

TG Magazine
Check out the latest issue of our flagship publication.