


Keeping House

Homeownership affordability—the ability to buy and own a home with the least possible financial inconvenience—has historically been higher in Texas than in the rest of the country, but that gap has narrowed since the Great Recession. Abilene, Pasadena, and Richardson were the state’s most affordable cities in 2017. |
Any homeowner will tell you there’s a lot more to affording a home than coming up with enough money to cover a down payment and closing costs. There are monthly mortgage payments, insurance premiums, and property taxes, not to mention general home maintenance costs. These expenses factor into overall homeownership affordability, which is the ability to purchase a home and continue to own it with the least possible financial inconvenience and hardship.
Homeownership affordability varies not only from state to state, but city to city. This could be important to potential homebuyers, particularly those looking to relocate to a different part of the state. What they pay each month to own a house in, say, Abilene, Pasadena, or Richardson may be quite different from what they’d pay in Laredo, Mesquite, or College Station.
Homeownership affordability can be measured in terms of the ratio of homeowner income to housing costs or the ratio of homeowner income to home price. The higher (lower) the ratio of homeowner income to home price or housing costs, the higher (lower) the homeownership affordability.
How the Lone Star State Measures Up
Real Estate Center research shows the average ratio of homeownership affordability in Texas from 2005 to 2017 was 4.48, higher than the national average of 4.24, ranking Texas 20th among U.S. states (Table 1). Unlike the U.S., which experienced little change in affordability in the Great Recession (GR) of 2008-09, Texas affordability improved because of historically higher oil prices during the recession.

Both Texas and the nation have experienced growing affordability since recovering from the GR, but the affordability gap between the state and the nation has narrowed since 2014 (Figure 1). Texas ranked 25th among states in 2017 mainly due to its recent slowdown in affordability (Table 2).


From 2005 to 2017, Texas’ homeownership affordability ratios remained well above those for more populous states like California, New York, and Florida (Figure 2). Texas’ affordability index in 2017, for which the latest data are available, was 4.83 compared with 3.95 for California and 4.37 for New York and Florida (Table 2).

Comparing Texas Cities
Among Texas cities for which data were available since 2005, Odessa ranked first in average homeownership affordability from 2005 to 2017 with an affordability ratio of 5.17 (Table 3). Midland followed with 5.01, then Abilene, 4.92; The Woodlands, 4.86; and Longview, 4.84. Laredo, with an affordability ratio of 3.81, was the least affordable city followed by Brownsville, 3.86; Garland, 4.04; Dallas, 4.06; and Grand Prairie, 4.18.

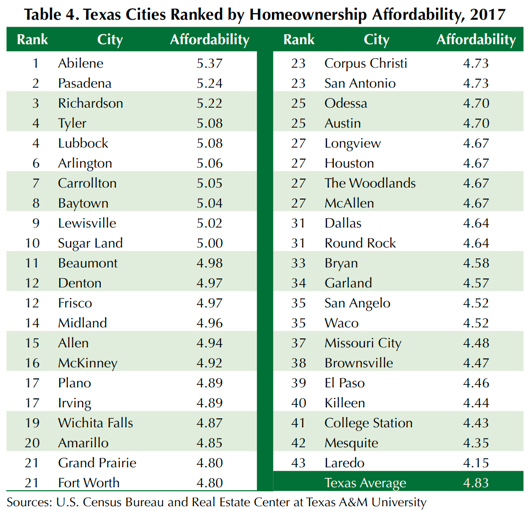
Homeownership affordability is a dynamic race between growth rates of homeowners’ incomes and their housing costs over time. Consequently, city and state rankings change over time depending on the relative growth rates of homeowners’ incomes and housing costs. Abilene was the most affordable city in 2017 with a homeownership affordability ratio of 5.37 (Table 4). Next was Pasadena, 5.24; Richardson, 5.22; Tyler, 5.08; and Lubbock, 5.08. Laredo, with an affordability ratio of 4.15, was the least affordable city in 2017 followed by Mesquite, 4.35; College Station, 4.43; Killeen, 4.44; and El Paso, 4.46.
Tracking Affordability Trends
Each Texas city has its own historical homeownership affordability trend. Some cities suffered during the GR, and some did not. While affordability ratios in some cities are currently trending upward, in other cities they are trending downward or are stabilized. Here are some findings from the Real Estate Center’s study of homeownership affordability trends since 2005.
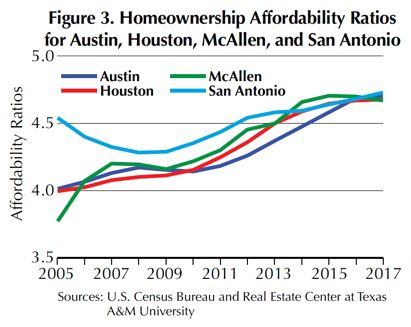
- Homeownership affordability ratios for Houston, Austin, San Antonio, and McAllen recently converged around 4.7 (Figure 3).
- Affordability in Dallas, Grand Prairie, Irving, and Waco is trending upward between 4.5 and five (Figure 4).
- Abilene, Arlington, Carrolton, and Pasadena are currently the most affordable Texas cities, with homeownership affordability ratios greater than five and trending upward (Figure 5).
- Ratios for Baytown, Beaumont, Denton, and Tyler rose in the GR then fell in the aftermath of the recovery from the GR. Since 2012–13, they have trended upward to converge around five (Figure 6).
- Allen, Lewisville, Lubbock, and McKinney are experiencing upward trends in homeownership affordability (Figure 7).
- Affordability in El Paso, Laredo, and Killeen has not changed significantly since 2014 (Figure 8).
- Since 2014–15, Amarillo, Corpus Christi, Frisco, and Plano have experienced mild downward trends (Figure 9).
- Since 2014, ratios in Longview, Mesquite, Round Rock, and San Angelo have significantly trended downward (Figure 10).
- Bryan, College Station, Sugar Land, and Wichita Falls are experiencing downward trends that began in 2015–16 (Figure 11).
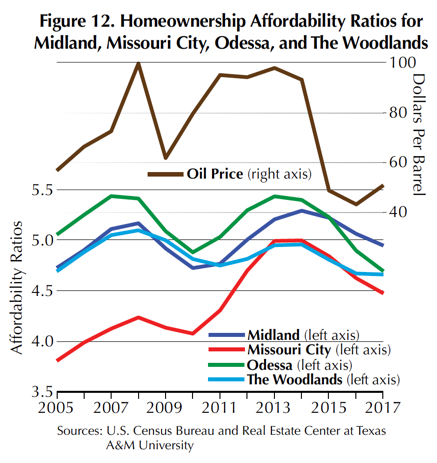
- Affordability in Midland, Missouri City, Odessa, and The Woodlands has moved in tandem with oil price changes with some lags (Figure 12).


About the Study
For this study, the Real Estate Center used the latest homeownership cost data from the U.S. Census Bureau’s American Housing Survey. The data are annual time series of median selected owner costs as a percentage of household income for housing units with a mortgage from 2005 to 2017 for the United States, individual states, and Texas cities. This percentage is an indicator of homeownership burden. The higher the percentage, the higher the portion of homeowner income spent on housing.
The inverse of this percentage (that is, 100 divided by the percentage of homeowner income spent on housing), is the ratio of homeowner income to homeowner costs and is an affordability indicator used in this research. A higher ratio of income to housing costs indicates higher homeownership affordability. For instance, if homeowner costs account for 25 percent of the owner’s income, then the affordability ratio is four (100 divided by 25). For Texas cities, the Hodrick-Prescott filter is used to purge short-run fluctuations and derive long-term affordability trends. For information on the Hodrick-Prescott filter, visit Investopedia or Wikipedia.
__________________
Dr. Anari ([email protected]) is a research economist with the Real Estate Center at Texas A&M University.
You might also like

TG Magazine
Check out the latest issue of our flagship publication.