


From a Distance


Takeaway A recent Austin study shows how city land prices change with distance from downtown, in direction from downtown, and over time. |
Many things determine the price of land in a city.
The most basic urban economics models consider only distance from downtown, which is commonly considered the center of economic activity because of its high-wage jobs and consumer amenities. Workers and residents are often willing to pay higher prices for land near downtown districts because living there lowers travel costs.
Although this model produces a simple, smooth bid price gradient for land, the real world is more complicated. Jobs and amenities, while centered around downtown, are spread out to some extent. Transportation costs will vary based on infrastructure, and government policy can have different impacts as well. Such real-world influences are why “location, location, location" will always be a real estate truism.
Studies consistently show distance from downtown does have an independent impact on land prices in cities. Estimated land price gradients around a city, or any other valuable location, reveal a relationship between average market price paid for land and the distance of the land from that valuable location. Because of travel costs’ influence on the price gradient, prices for land near a major transportation corridor would be expected to fall at a lower rate than prices for land farther away. Also, in any given direction there may be alternative amenities that support higher land prices in that general direction or within a localized area within a corridor.
Austin Land Price Gradient by Corridor
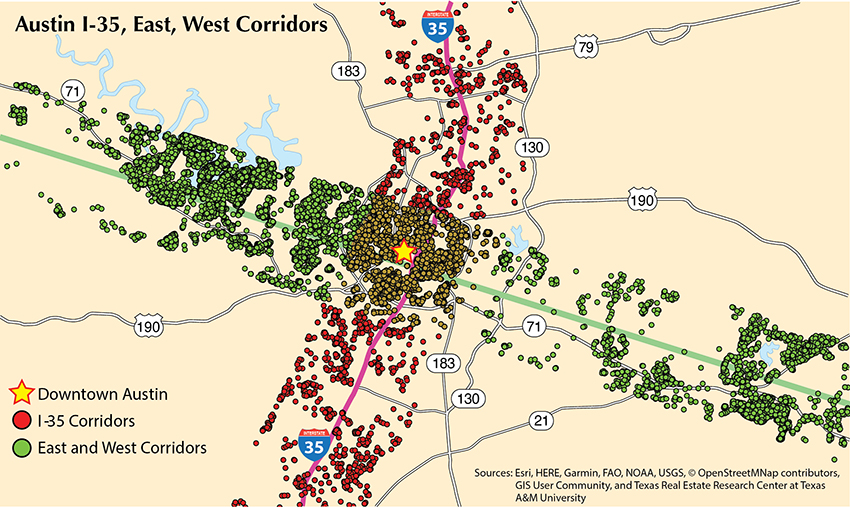
This analysis looks at estimated land price gradients of four alternative corridors in the Austin area: I-35 North, I-35 South, and the eastern and western corridors. North versus south and east versus west are defined relative to the center of the Congress Street Bridge over the Colorado River.
The I-35 corridors include the area within five miles of I-35. The east and west corridor is a straight-line corridor generally perpendicular to I-35 where it crosses the Colorado River. The map shows all known lots and land sales in these corridors over the analysis period. The Austin region was defined as the Austin Metropolitan Statistical Area (MSA) plus contiguous counties.
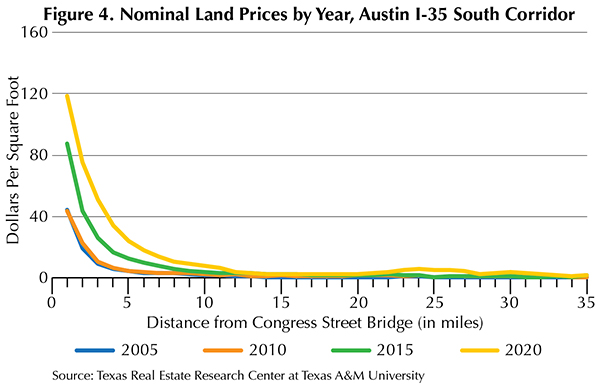
Nominal land prices along each corridor increased regularly from 2005 through 2010, 2015, and 2020 (Figures 1-4). Land prices for 2005 and 2010 are relatively close, largely because 2005 was the beginning of the run-up in housing and land prices before the Great Recession, and 2010 was the bottom of the lull after the bust. Since 2010, lots and land prices across corridors have consistently increased, with significantly larger absolute increases closer to downtown Austin.


Figures 5 and 6 show the estimated land price gradients for each corridor for 2005 and 2020, respectively.
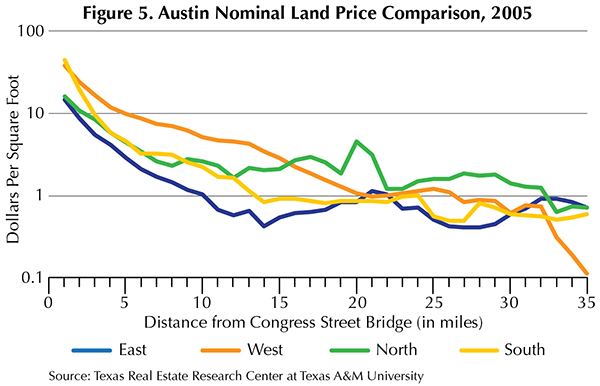

In 2005, the eastern corridor had the consistently lowest land price gradient until 18 miles out. By that point, the gradient had reached a minimum and started to increase, possibly because it was approaching some other local attraction, and not just because of its proximity to Austin.
The southern corridor had the highest average estimated land price in the 2005 first-mile estimates, but a steep gradient led to the corridor having the second-lowest prices after 12 miles.
Land prices in the north were the second lowest for the first few miles, but a flat gradient made them the second highest at miles 12 through 15. After that, the north had the highest estimated prices.
The western region consistently showed some of the highest estimated land prices from close in through mile 15.
Land prices in 2020 increased from 2005, but there was less relative difference between the corridors (Figure 6). Close to town, the southern and western corridors continued to have the highest estimated land prices, and most of the patterns described for 2005 remained. Over this period, the eastern corridor’s estimated land prices rose the quickest, closing the gap with the southern corridor’s gradient by the 12th mile. The relative differences in the slopes of the northern and western corridors have also shifted so the northern corridor generally shows the highest estimated land values from mile 12 onward.
Location, Location, Location
Austin land prices are obviously not constant, and “location, location, location" includes distance and direction from many possible points of interest.
The relative values of different locations are also not fixed through time. Even by considering only direction and distance to downtown, one can see the potential influence of the great many considerations that people may put into deciding where to live and work within the greater region.
____________________
Dr. Perdue ([email protected]) is a research
economist with the Texas Real Estate Research Center at Texas A&M University.
You might also like

TG Magazine
Check out the latest issue of our flagship publication.