


A Fistful of Texas Dollars


New Real Estate Center research shows Texans pay less than the national average for goods and services, although price differences vary among Texas’ 25 Metropolitan Statistical Areas. Rising housing rents are eroding the price differential between Texas and the rest of the country. |
Anyone who’s traveled around the United States knows the same amount of cash purchases different quantities of goods and services in different regions because of price differences across those regions. Regional price parities (RPPs) estimated by the U.S. Bureau of Economic Analysis (BEA) measure differences in general price levels across states and metropolitan areas for a given year and are expressed as a percentage of the overall national price level. They allow comparisons of buying power of incomes, which is especially helpful for job-seekers and retirees considering moving.
New Real Estate Center research shows Texas produces goods and services at prices lower than national averages. However, the growing housing rent component of services is eroding the price differential between Texas and the rest of the U.S. Texas rents are soaring the most in larger metros and in Midland and Odessa.
Understanding Regional Price Parities
BEA compiles four time series of RPPs for states and metros: All Items, Goods, Rent, and Other Services. All Items RPPs cover all consumption goods and services, including rents. RPPs are about the quantities, not the quality, of goods and services that can be purchased across areas for the same dollar amount. Differences in rents and housing costs may reflect the real estate mantra “location, location, location." Nevertheless, RPP data show which areas are more expensive to live compared with national averages.
While price indexes, like the consumer price index for Houston, commonly measure price changes over time, RPPs are spatial price indexes. They measure price differences across regions for one period. Regions with higher (lower) RPPs are relatively more (less) expensive. For example, if Texas’ RPP is 95 and California’s is 110, then, on average, prices of goods and services are 5 percent lower in Texas and 10 percent higher in California than the U.S. average.
These RPPs compare states’ or metros’ purchasing power with that of the U.S. To compare the purchasing power between two regions, say Texas and California, look at the ratio of their RPPs.
RPPs are equivalent to exchange rates between countries. If the price of a Big Mac in the U.S. is $3.50 and in the U.K. £2.5, then the £/$ exchange rate is 3.5/2.5=1.4 (Figure 1). The value of a dollar is higher (lower) in places where goods and services are less (more) expensive. RPPs express a region’s price level relative to the U.S. and make it possible to compare regions within the U.S. without currency conversion. Dividing 100 (the base value of $1.00) by a region’s RPP shows the value of one dollar, or exchange rate, in that region.

RPPs are calculated using consumer price index data from the U.S. Bureau of Labor Statistics, rent data from the Census Bureau’s American Community Survey (ACS), expenditure weights for each category from BEA’s personal consumption expenditures, and ACS rents expenditures.
Comparing Texas, California, New York, and Florida RPPs
Texas’ All Items RPP in 2016 was 96.9 percent (Table 1), smaller than the corresponding RPPs for California (114.4 percent), New York (115.6 percent), and Florida (99.7 percent). Goods and services were 3.1 percent less expensive in Texas than the national average. California and New York residents paid 14.4 percent and 15.6 percent more than the national average, respectively, for the same quantities of goods and services, while Florida residents paid 0.3 percent less. Dividing 100 by the corresponding RPPs for the four states gives the value of a dollar in each state (Table 1). The value of a Texas dollar in 2016 for All Items was 1.03, more than California, New York, and Florida.
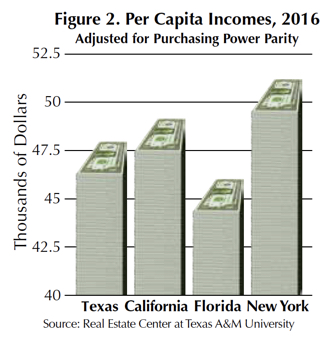
Per capita incomes in 2016 in Texas, California, Florida, and New York were $46,204, $56,308, $45,855, and $59,289, respectively. Adjusted for purchasing power parity (that is, dividing per capita incomes by their respective RPPs and multiplying by 100), they were $47,682 (Texas), $49,220 (California), $45,993 (Florida), and $51,288 (New York) (Figure 2).
Texas’ Goods RPP in 2016 was 97.2 percent (Table 1). This means they paid 2.8 percent less than the national average for goods. Florida residents paid 1.7 percent less for the same quantities. Residents of California and New York paid 3.6 percent and 9 percent more, respectively. The value of a Texas dollar in 2016 for Goods was 1.03, close to Florida but more than California and New York.
Rent RPPs for the four states show that much of the difference between the states’ cost of living is due to housing costs (Table 1). Texas’ Rent RPP in 2016 was 93.7 percent, lower than Florida (106.1) and much lower than California (148.4) and New York (133.2). A dollar spent on rent in Texas delivered $1.07, while in California it was worth 67 cents and in New York 75 cents. A job-seeker considering renting a home in Texas for $9,370 per year would pay $10,610 in Florida, $14,840 in California, and $13,320 in New York.
Texas’ Other Services RPP (that is, services excluding rents) in 2016 was 98.6 percent (Table 1), less than the corresponding RPPs for California and New York but more than Florida. This means Texans paid 1.4 percent less than the national average for Other Services. California and New York residents paid 6.8 percent and 11.6 percent more, respectively, for the same quantities of services while Florida residents paid 3 percent less.
Texas’ Rent RPP index increased from 88.2 percent to 93.7 percent of national averages from 2008 to 2016 while RPPs for Goods decreased from 98.6 to 97.2 percent. RPPs for Other Services decreased from 99.1 percent to 98.6 percent over the same period. The growing costs of housing in Texas have been offset by the decreasing costs of goods and services. Consequently, the All Items RPP for Texas increased just slightly from 96.5 in 2008 to 96.9 in 2016.

Purchasing Power of Texas Metropolitan Dollars
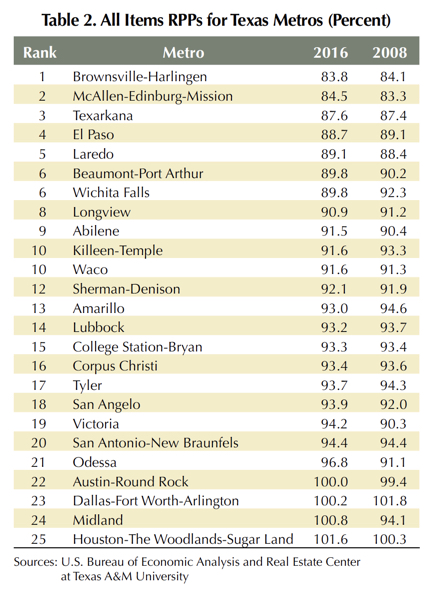
Texas’ All Items RPP indexes are averages of RPP indexes of the state’s metropolitan and micropolitan areas. Like RPPs for states, metropolitan RPPs show the purchasing power of one dollar in a metro area compared with the national average. There are substantial differences among the All Item RPPs for the state’s metros.
The larger metros and the petroplexes of Midland and Odessa are relatively more expensive places to live than, for example, metros along the border (Table 2). Brownsville-Harlingen is the state’s least expensive metro followed by McAllen-Edinburg-Mission, Texarkana, El Paso, and Laredo. Houston-The Woodlands-Sugar Land is the most expensive metro followed by Midland, Dallas-Fort Worth-Arlington, Austin-Round Rock, Odessa, and San Antonio-New Braunfels.
Goods and services in some metros, like Austin-Round Rock and Houston-The Woodlands-Sugar Land, became more expensive from 2008 to 2016 while Dallas-Fort Worth-Arlington became less expensive.
Metropolitan RPPs determine how much in goods and services a dollar can purchase in a metro, but keep in mind that income varies across metro areas. Adjusting an area’s income by its RPP gives a more realistic picture of that area’s affordability (Table 3). In metros with lower (higher) than national average RPPs, adjusted per capita incomes are higher (lower) than unadjusted per capita incomes. Per capita income data include students’ incomes and populations. This explains lower per capita income for areas with a relatively large student population such as College Station-Bryan.

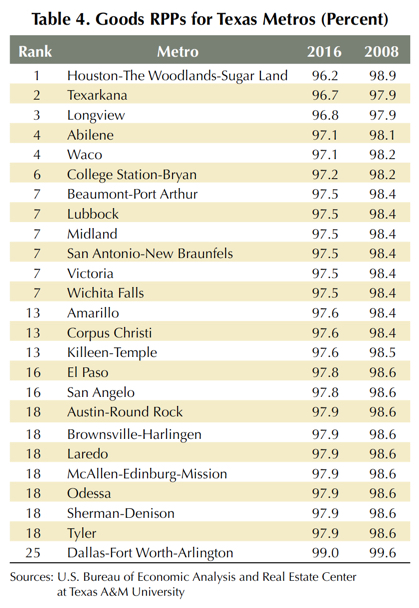
Goods RPPs across Texas metros in 2016 varied in a relatively narrow range from 96.2 percent for Houston to 99 percent for Dallas-Fort Worth-Arlington (Table 4). By contrast, Rent RPPs that year varied from 57.1 percent in Brownsville-Harlingen to 130.2 percent in Midland (Table 5). Brownsville-Harlingen had the least expensive rental market followed by McAllen-Edinburg-Mission, Texarkana, Beaumont-Port Arthur, Laredo, and El Paso. Midland had the highest rent RPP followed by Austin-Round Rock, Houston-The Woodlands-Sugar Land, Dallas-Fort Worth-Arlington, Odessa, and San Antonio-New Braunfels. Metros with high/low All Items RPPs tracked closely to those with high/low Rent RPPs (Tables 2 and 5).

____________________
Dr. Anari ([email protected]) is a research economist with the Real Estate Center at Texas A&M University.
You might also like

TG Magazine
Check out the latest issue of our flagship publication.