


Eye on Texas Mortgage Debt


Texans typically have lower mortgage debt compared with the rest of the U.S. They have to set aside less for housing expenses, and they pay lower initial costs and fees for mortgages, although that wasn’t always the case. |
Comparing Texas residential mortgage debt to national levels reveals four compelling points.
- Texas historically maintains a smaller percentage of homeowners with mortgages;
- Texans typically incur lower levels of mortgage debt;
- Texas households allocate a smaller percentage of household income for housing expenses; and
- Texas mortgage rates generally exceed the national average rate.
All of these appear to be attributable to lower than national average Texas home prices.
Texas Residential Mortgage Status
A mortgage is a loan secured by real property repaid from the future steam of income of the borrower household or firm. Since the current income of most households and firms is normally not sufficient to buy real estate for cash, the availability, terms, and cost of mortgage loans become a main driver of the market. Like real estate in general, mortgage debt categories include all manner of residential or commercial loans depending on the type of the property used as security. This article focuses on residential mortgages, which include second mortgages and home equity loans. Technically, Texas loans are secured by real estate using a deed of trust rather than a mortgage instrument, but for purposes of this discussion, they are considered the same.
According to the Census Bureau, Texas had 3,334,400 housing units with a mortgage in 2015, accounting for 58 percent of the total owner-occupied housing units in the state, compared with the 63.3 percent national average (Table 1). The state’s relatively smaller percentage of homes with a mortgage is mainly due to lower-than-national-average home prices in Texas that enable 42 percent of Texas households either to finance a home purchase using cash or to repay the mortgage sooner. Since 1978, the price of a Texas home purchased with a mortgage averaged $161,000 or 82 percent of the national average price of $196,300 (Figure 1).


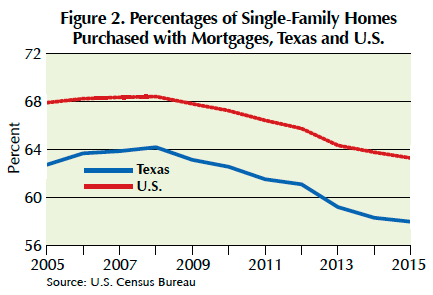
The percentages of homes purchased with a mortgage trended upward in both Texas and the U.S. before the Great Recession (GR) of 2007–08, from 62.7 percent in 2005 to 64.2 percent in 2008 for Texas and from 67.9 to 68.4 percent for the U.S. (Figure 2). In the aftermath of the GR, these figures drifted downward, falling to 58 percent in 2015 for Texas and 63.3 percent for the U.S.
Lower mortgage debt and lower mortgage costs in the state also result from significantly less secondary financing in Texas. Approximately 6 percent of the mortgaged homes in Texas in 2015 carried a first loan and either a second loan or a home equity loan, whereas more than 14 percent of the mortgaged homes nationally included either a second or a home equity loan. Less reliance on second mortgage financing alleviated much of the housing foreclosures that occurred around the country during the housing collapse in 2008–10 (Table 1).
As well as having a lower percentage of homes with a mortgage, Texas homeowners generally incurred less mortgage costs due to lower average home prices (Table 2 and Figure 3). Median monthly mortgage costs of owner-occupied housing units in both Texas and the U.S. trended upward before the GR, reaching $965 per month for Texas in 2010 and $1,090 for the U.S. in 2008 (Figure 3). This upward trend reversed during the GR due to falling mortgage rates engineered by the Federal Reserve Bank to help the U.S. economy recover from the GR. Monthly mortgage costs for Texas homeowners fell to $941 in 2013 and decreased to $995 nationally in 2014. As the state and nation recovered from the GR, average monthly mortgage costs reversed their downward trend and rose to $973 for Texas and $1,009 for the U.S. by 2015 (Figure 3 and Table 2).


Lower-than-national-average mortgage costs enabled Texas households to allocate smaller shares of their incomes for housing costs (Table 3). Since 2010, the median monthly homeowner costs as percentages of household incomes in owner-occupied housing units in both Texas and the U.S. trended downward. They fell from 23.4 percent in 2010 to 21.1 percent in 2015 for Texas and from 25.1 percent to 22 percent for the U.S. (Figure 4). On average, Texas households with a mortgage allocated 22.6 percent of their income for housing costs compared with a national average of 24.1 percent for the U.S. from 2005 to 2015 (Figure 4).


Lower than national average home prices also enabled Texas households to maintain mortgage debt balances smaller than national averages (Figure 5). Texas per capita mortgage debt in the second quarter of 2010 was $23,999 compared with $36,339 for the nation, or 66 percent of the nation’s per capita mortgage debt burden. Per capita in this context refers to the number of individuals with a credit report. The mortgage loan balances in both Texas and the U.S. have trended downward since 2010, falling to $23,770 in Texas and $31,830 in the U.S. in fourth quarter 2016 (Figure 5).

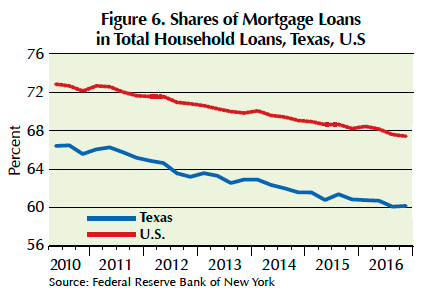
Texas’ household share of mortgage loans as a percentage of total household loans fell from 66.4 percent of total loans in the second quarter of 2010 to 60.1 percent in fourth quarter 2016 (Figure 6). The nation’s shares of mortgage loans fell from 72.9 percent to 67.4 percent over the same period (Figure 6).
Texas Mortgage Rates
Texas’ average annual contract rate for conventional, single-family mortgage loans tracks close to the national averages (Figure 7), but the initial fees and charges for Texas mortgage loans display four distinct periods of difference compared with national levels (Figure 8). From 1978 to 1991, mortgage lenders charged higher initial fees to Texas borrowers, especially in 1982 when initial fees and charges for Texans equaled 4.4 percent compared with 2.7 percent nationally. From 1992 to 1997, average initial fees and charges in Texas were lower than national averages.

Initial fees and charges in Texas coincided with the U.S. average from 1998 and through the GR until 2009. After 2010, average initial fees in Texas slightly exceeded the national average but converged again to the national average in 2015. From 1978 to 2015, the initial mortgage loan fees and charges in Texas averaged 1.49 percent compared with 1.26 for the U.S. or 23 basis points more. Initial fees and charges reflect various costs and risks associated with mortgage loans as well as general economic and banking conditions.
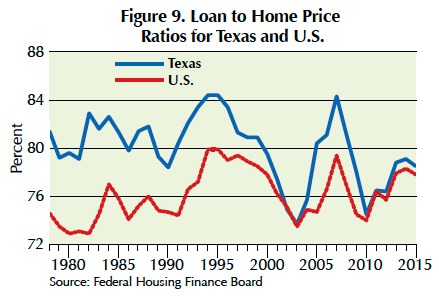
On a micro level, two main factors contributed to higher fees and charges for Texas mortgage borrowers, namely, higher loan-to-value ratios and longer terms to maturity. Texans experienced higher loan-to-value ratios because of lower-than-national-average home prices (Figure 9). From 1978 to 2015, the average loan-to-value ratio for Texas was 80 percent compared with 76.1 percent for the U.S. The state also had mortgage loans with average term to maturity longer than national averages before 1987 (Figure 10). The average term to maturity for Texas mortgage loans from 1978–87 was 27.3 years compared with 26.4 years for the U.S.

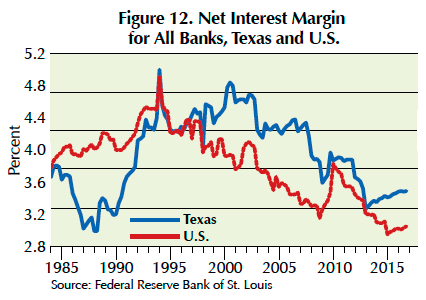
On a macro level, Texas’ banking system was in turmoil in the late 1980s. Price per barrel of West Texas intermediate crude oil fell from close to $39.50 in 1980 to $13.90 in 1986. The average percent of loan loss reserves to total loans for all Texas banks climbed to 5.4 percent in third quarter 1988 compared with 2.59 percent for the U.S. (Figure 11). Net interest rate margin for all Texas banks fell to 2.99 percent in second quarter 1988 compared with 4.03 percent for the U.S. (Figure 12). The state’s adverse economic and banking conditions in the late 1980s led lenders to charge higher initial fees. The average initial fees and charges for Texas from 1978 to 1991 totaled 2.69 percent compared with 2.05 percent for the U.S. As the state’s economy recovered from the impacts of lower oil prices, Texas’ mortgage rates and fees converged toward national average levels after 1997.

____________________
Dr. Anari ([email protected]) is a research economist and Dr. Gaines ([email protected]) is chief economist with the Real Estate Center at Texas A&M University.
You might also like

TG Magazine
Check out the latest issue of our flagship publication.