


Downsized


The recent economic downturn spurred by COVID-19 has decreased incomes for many households. This could diminish their ability to purchase homes they could have afforded before the pandemic. |
Owner-occupied affordability is currently one of the most important issues in housing. In light of COVID-19, concerns over housing affordability have grown. Economic uncertainty and decreases in household income because of layoffs may limit some households’ ability to purchase a home.
According to the National Association of Realtors, 86 percent of households in 2019 relied on mortgage financing to purchase a home. Because of this, evaluating a household’s ability to qualify for a mortgage loan and understanding the impact of economic downturns on the potential of households to attain homeownership is important.
Evaluating Mortgage Applicants
Mortgage lenders evaluate applicants’ creditworthiness based on a range of criteria, such as the applicant’s employment and credit histories, the presence of a co-applicant, the number of dependents, and the age of the applicant (and co-applicant).
However, the three most important criteria are the applicant’s wealth, income, and credit score. Known as borrowing constraints, these criteria are measured through the loan-to-value (LTV) and debt-to-income (DTI) ratios and the credit score. Lenders are primarily concerned with the borrower’s ability to repay the mortgage loan (i.e., the odds the borrower will default on the loan) and his decision to prepay the loan, which lowers the cumulative interest the lender could have collected.
Generally speaking, higher LTV and DTI ratios and lower credit scores decrease an applicant’s creditworthiness (i.e., increase the risks the applicant poses to the lender). Typically, the LTV and DTI ratios are lower and the credit score higher among borrowers qualifying for conventional loans, while the ratios are higher and the credit score lower among borrowers with government-insured mortgages (Federal Housing Administration, or FHA, Veterans Affairs, or VA, or Rural Housing Service, or RHS/FSA, loans).
Quantifying Owner-Occupied Affordability
Affordability measures the relationship between housing costs and household income. The majority of borrowers rely on mortgage financing to purchase a home, so measures of owner-occupied affordability typically use the mortgage payment to represent housing costs. The mortgage payment incorporates the borrower’s LTV and DTI ratios, interest rate, property taxes, and insurance.
One of the most often used measures of owner-occupied affordability is the home-price-to-income multiplier, which represents the ratio between home price and household (or family) income. While there is no maximum multiplier beyond which a household will be unable to qualify for a mortgage loan, the odds of receiving a loan decrease as the multiplier increases, particularly when the multiplier exceeds 4.0. The multiplier for the majority of mortgage loans typically measures between 3.0 and 4.0 except in extremely high-priced markets, such as San Francisco or New York, where buyers may be forced to pay six to eight times their income (double the typical multiple).
Home-price-to-income multipliers for different combinations of the LTV and DTI ratios are shown in Table 1. They assume a mortgage interest rate of 3 percent. Borrowers with an LTV ratio exceeding 80 percent usually pay private mortgage insurance (PMI) as well to compensate for the additional risk posed to the lender. PMI costs vary but generally add an additional 0.5 percent. The additional costs of homeownership, including taxes, insurance, and utilities, are assumed to be 6 percent of the home’s annual value estimate.

Holding the DTI ratio constant as the LTV ratio increases from left to right, the multiplier decreases (i.e., the maximum home price affordable to a particular household based on their fixed income decreases). Meanwhile, holding the LTV ratio constant as the DTI ratio increases from top to bottom, the multiplier increases (indicating that the maximum home price affordable to a particular household increases).
To maximize the home price affordable to them, borrowers would have to decrease the LTV ratio (increase the downpayment) while increasing the DTI ratio (increase the mortgage debt or "front-end" debt relative to total household debt or "back-end" debt). However, borrowers can only reach a certain level of indebtedness beyond which the lender would be unwilling to originate a mortgage loan. Furthermore, increasing the downpayment may not be possible.
The typical conventional loan is generally assumed to have LTV and DTI ratios of 80 percent and 25 percent, respectively, which in this instance equates to a multiplier of 2.49. The LTV and DTI ratios for an FHA loan are assumed to be 96 percent and 43 percent, respectively, for a multiplier of 3.85. In other words, average borrowers with a conventional loan could afford a home priced at 2.49 times their income, while average borrowers with an FHA loan could afford a home priced at 3.85 times their income. Conventional mortgages made up 75 percent of all home purchase originations for owner-occupied, one-to-four-bedroom, single-family properties in 2018 and 2019. FHA mortgages made up 15 percent. Department of Veterans Affairs (VA), Rural Housing Service (RHS), and Farm Service Agency (FSA) mortgages constitute the other 10 percent of such originations.
The maximum home price affordable to conventional and FHA borrowers at home price-to-income multipliers of 2.49 and 3.85, respectively, is calculated in Table 2. Compared with conventional mortgages, FHA financing greatly increases the maximum home price affordable to a household. For example, a household with an annual income of $60,000 could afford a $149,292 home with a conventional mortgage or a $230,914 home with an FHA mortgage. That approximate $81,000 differential impacts a household’s ability to purchase a home, particularly in Austin, Dallas-Fort Worth, Houston, and San Antonio, where home prices are generally higher.

COVID-19 and Household Income
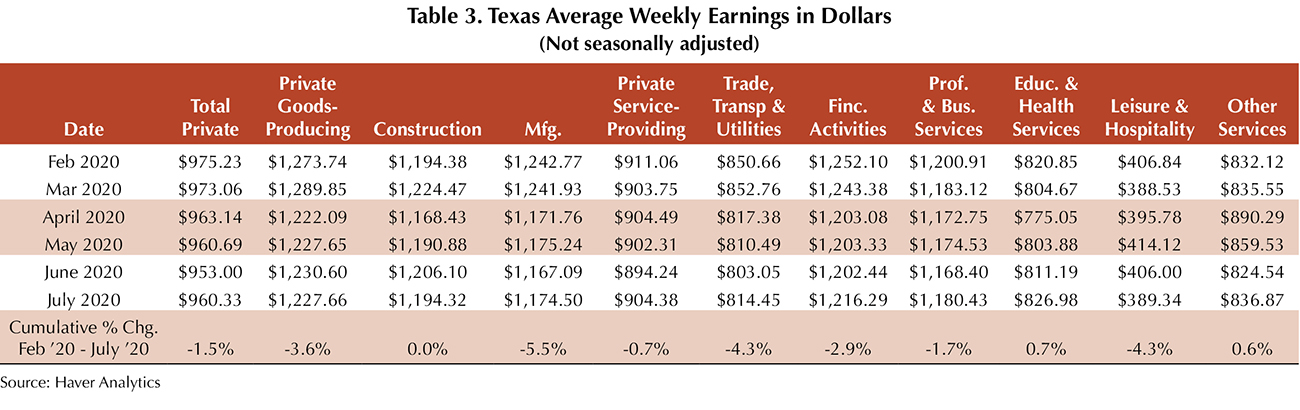
While COVID-19 has adversely impacted the overall economy, certain sectors have had greater declines in average weekly earnings than others (Table 3). From February to July 2020, the three hardest hit sectors in Texas were manufacturing (5.5 percent decline in average weekly earnings); trade, transportation, and utilities (4.3 percent decline); and leisure and hospitality (4.3 percent decline).
In 2019, the average weekly earnings for manufacturing amounted to $1,225; for trade, transportation, and utilities, $815; and for leisure and hospitality, $396. This equates to annual before-tax earnings of $63,700 in manufacturing; $42,380 in trade, transportation, and utilities; and $20,592 in leisure and hospitality. Should the cumulative decline in average weekly earnings from February to July hold for all of 2020, annual earnings will decline by $3,504 in manufacturing; $1,822 in trade, transportation, and utilities,; and $885 in leisure and hospitality.
Impact of Income Decline on Affordability
The decrease in the maximum home price affordable to a particular household based on a $5,000 decrease in household income is shown in Table 4. For example, for a household with a $60,000 income that obtains financing for a conventional mortgage (LTV ratio of 80 percent and DTI ratio of 25 percent), the maximum affordable home price would decrease by $12,441 for every $5,000 decrease in income. Assuming FHA financing (96 percent LTV and 43 percent DTI), the maximum home price affordable to that same household would decrease by $19,243 for every $5,000 decrease in income.
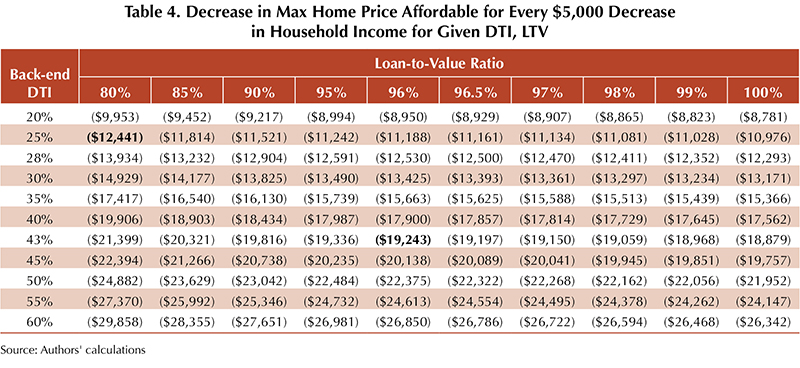
The values can be computed for a $10,000, $15,000, or $20,000 decrease in household income simply by multiplying each value by two, three, or four, respectively. Similarly, the values could be computed for a $1,000 decline in household income by dividing each value by five.
With the LTV ratio held constant as the DTI ratio increases, the decline in the maximum home price affordable for every $5,000 drop in household income becomes more severe. For example, a household with a LTV ratio of 96 percent sees an $8,950 decline at a DTI of 20 percent versus a $20,138 decline at a DTI of 45 percent.
Conversely, holding the DTI ratio constant as the LTV ratio increases causes the drop in the maximum home price affordable for every $5,000 decrease in household income to lessen. A household with a DTI ratio of 30 percent will see a $14,929 decline at an LTV ratio of 80 percent versus a $13,361 decline at a 97 percent LTV ratio.
Households that have a decline in income could compensate for the loss by reducing their downpayment (maximizing their LTV ratio) and their ratio of monthly mortgage debt relative to total debts (minimizing the DTI ratio). The former will prove easier to accomplish than the latter.
____________________
Dr. Hunt ([email protected]) is a research economist and Losey a research intern with the Real Estate Center at Texas A&M University.
You might also like

TG Magazine
Check out the latest issue of our flagship publication.