


Curb Your Enthusiasm


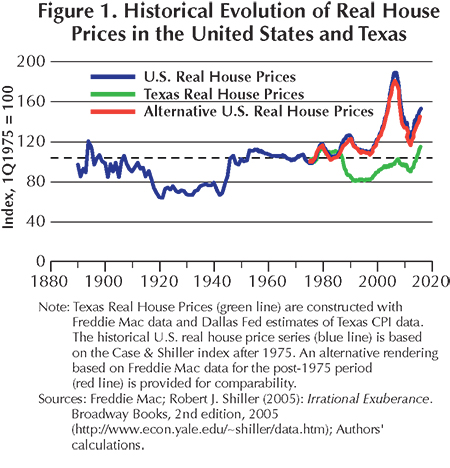
 Years after the largest housing bust in United States history, could another boom be developing? Texas avoided much of the 1998–2006 housing boom and subsequent collapse in real (inflation-adjusted) house prices during the Great Recession (Figure 1). However, since the housing rebound took hold in 2012, Texas has registered strong price appreciation similar to that of the U.S. Could this mean another housing boom is underway? If so, should we worry about it?
Many housing analysts and scholars share the view that the 1998–2006 housing boom resulted from a departure of house prices from their intrinsic values, which are determined by economic fundamentals. This led to a misallocation of resources in the economy and distorted investment patterns. Eventually, it precipitated the Great Recession in the U.S., which spilled over into many developed countries. Learning from such experiences may help avoid a repeat of the trauma caused by the latest boom-bust housing cycle.
A rapid pace of real house price appreciation during a boom by itself does not necessarily imply that house prices are becoming out of step with the fundamentals of the housing market. However, real house price increases can result from a misalignment with fundamentals if, for example, recent trends of high-growth performance drive market participants to expect higher prices in the future.
An expectations-driven misalignment of this sort is often called a bubble. In a situation like this, buyers are willing to invest in houses above their fundamental value if they expect to be compensated through future price increases. If enough buyers share the same beliefs about the market, they will drive current house prices up. The robust gains achieved through price appreciation then sustain a self-fulfilling prophecy, providing validation to the buyers’ expectation of rapid house price growth. This keeps the market misaligned from its fundamentals until enough investors become leery of a bust, the flow of money into housing dries out, and eventually the feared collapse occurs.
Detecting a misalignment in house prices from their fundamental-based intrinsic values, let alone preventing one, is not a simple task. The difficulty arises because actual house prices can be observed and measured, but the intrinsic value of housing cannot. Economists instead look at home prices that would have otherwise prevailed in the market under similar conditions, ruling out expectations-driven bubbles. This entails discriminating across different existing theories that disagree on the main drivers of the housing market demand and supply and working with often incomplete data. On the demand side, fundamental factors could include demographics, income and employment growth, access to credit, and interest rates. The supply side factors are construction costs (the price of lumber, drywall, and labor wages), the housing stock, and land availability.
Research has opened up new avenues to tackle the detection of misalignments using new statistical tools and techniques to monitor the behavior of prices over time and make inferences without being tied to a particular fundamentals-based model. One such approach revealed that house prices change in a predictable way when an expectations-driven bubble occurs—they become explosive (or exuberant). Therefore, new techniques to detect exuberance may detect or signal the formation of housing bubbles.
This is especially useful if it can identify a boom arising from a fundamental misalignment before the housing bust occurs. It is best to use it in conjunction with economic fundamentals and other available signals tracking house price increases since no one indicator has the ability to identify such misalignments with certainty and timeliness.
Explosive Behavior in Texas Real House Prices
In Texas, two periods of explosive behavior were identified before and during periods of recession in Texas and the U.S. The first occurred during the late 1980s oil bust, pushing the Texas economy into a recession. House prices in the state broadly collapsed while those in the rest of the country did not (Table 1 and Figure 1). The second period was before and during the shallow 2001 national and state recessions. This coincided with a prolonged period of exuberance with significant real appreciation of housing. For the state, the episode ended much earlier, allowing Texas to avoid the worst of the housing fallout that caused so much damage elsewhere in the U.S. (Table 1 and Figure 1).
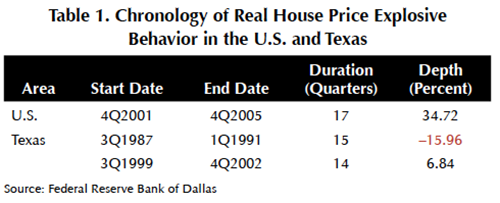
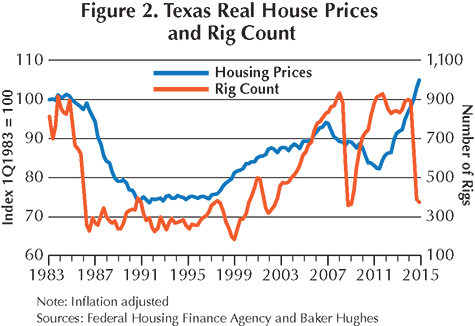
The U.S. and Texas housing markets have had dissimilar experiences over the past 40 years. They share common factors that could contribute to the spread of house price exuberance, such as access to mortgages, federal housing and tax policy, and the decline in U.S. interest rates since the end of the 1990s. But the documented differences (Table 1) could be related to the importance of the oil industry in Texas (Figure 2), the high supply elasticity of housing in the state, and differences in home-equity lending (for example, total mortgage debt cannot exceed 80 percent of the fair market value of the home) among other factors.
This research found that differences across regional housing markets in Texas result in differences in the patterns of exuberant behavior in the 25 Metropolitan Statistical Areas (MSAs). The results indicate that episodes of exuberant behavior were widespread. Ripple effects from oil boom and bust periods, especially during the 1980s, and from the continuous decline in U.S. interest rates since the 1990s, underpin what occurred in most MSAs, but regional factors also play a role in the likelihood that a period of exuberance will occur.
The chronology of exuberant house price behavior in the state’s four major MSAs (Austin, Dallas-Fort Worth, Houston, and San Antonio) is shown in Table 2. Commonalities and differences were found, notably that Austin and DFW appear largely insulated from the rest of the state and the U.S. Interestingly, San Antonio follows the pattern of the U.S. housing market more closely than that of Texas, registering a prolonged period of exuberant behavior during the national housing boom in the early 2000s. Houston’s housing has more similarities with the state and, in particular, with the chronology of the main energy-related MSAs in Texas (Table 3).
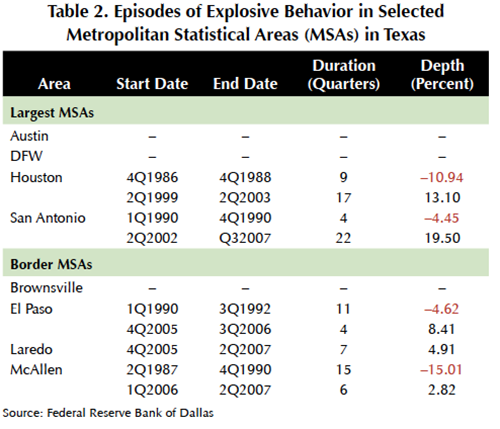
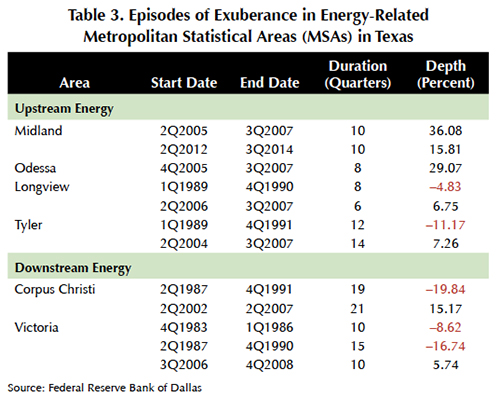
Table 2 also includes the same statistics for the four major Border MSAs (Brownsville, El Paso, Laredo, and McAllen). El Paso and McAllen in particular experienced periods of exuberance during the late 1980s and early 1990s. El Paso, Laredo, and McAllen shared a period of exuberant behavior later than the state as a whole. This appears to coincide with the tail of the U.S. housing boom.
The energy-related MSAs had
explosive price behavior in housing as well, but with notable differences from the
rest of the state. Upstream energy MSAs Midland and Odessa did not register a
period of exuberance in the 1980s. However, Longview, Tyler, the downstream
energy MSAs including Corpus Christi and Victoria (Table 3), and the state as a
whole did. During the last part of the U.S. period of exuberance (mainly from 2004–07),
both upstream and downstream energy regions registered periods of exuberant
behavior that set them apart from the rest of the state (Table 3).
Current Developments in Texas Housing Markets
Neither the state of Texas nor any of its 25 MSAs currently are having episodes of explosive behavior in house prices. The map (Figure 3) illustrates how the different housing markets look with the data available up to 3Q2015.
The map also provides detail about the performance of selected MSAs over the past five quarters. Pie charts have been superimposed over a few MSAs. DFW appears in green with no pie chart because it has shown no hint of explosiveness since at least 3Q2014. In contrast, Midland appears with an amber and red pie chart because—while currently amber—it has spent one period in the red zone since 3Q2014. Three of the major MSAs (Austin, Houston, and San Antonio) plus College Station-Bryan experienced some unusual price movements and are currently amber in 3Q2015 after experiencing at least one green period since 3Q2014.

Explosive Behavior Same as a Bubble?
A word of caution is warranted. Are these periods of explosive behavior the same as housing bubbles? The answer is they are not. Ultimately, to determine whether a period of explosive behavior is expectations-driven and nonfundamental, researchers need to overcome the problem of how to properly measure the fundamentals and through them the intrinsic value of housing. The approach used here adds a powerful new tool for monitoring housing markets, though.
The Federal Reserve Bank of Dallas aims to monitor Texas local housing markets and those of the rest of the U.S. They plan to make this information available on the Fed’s website to help inform market participants and scholars alike about housing. The Real Estate Center at Texas A&M University will continue to monitor this statistic once available to the public. The information will appear in its monthly publication, Texas Housing Insight, which follows the state’s housing market.
____________________
Dr. Torres ([email protected]) is a research economist with the Real Estate Center at Texas A&M University. Dr. Martínez-García ([email protected]) is a senior research economist and advisor and Ms. Grossman ([email protected]) is a senior research analyst in the Research Department of the Federal Reserve Bank of Dallas. We thank Mark Wynne, vice president of the Federal Reserve Bank of Dallas, for helpful feedback. All remaining errors are ours alone. The views expressed in this article are those of the authors and do not necessarily reflect the views of the Federal Reserve Bank of Dallas or the Federal Reserve System.
You might also like

TG Magazine
Check out the latest issue of our flagship publication.