


Contrasting Costs

According to 2017 Census data, Texas ranks 18th among all U.S. states in average annual homeowner costs, which include real estate taxes, insurance premiums, utility payments, and any debts on a property. It ranks seventh in terms of homeowner costs as a percentage of home prices. |
Texas homeowners with a mortgage pay an average of $18,156 per year in housing costs. Homeowner costs, however, vary depending on where the home is located.
On the upper end of the scale, 2017 data compiled by the Real Estate Center show Frisco homeowners have the highest costs in the Lone Star State (Table 1). Annual costs in the North Texas city are $30,936.
Residents of The Woodlands ($29,016), Sugar Land ($28,044), Flower Mound ($27,084), Cedar Park ($25,716), and McKinney ($25,008) pay some of the highest costs in the 59 cities studied.
At $13,104 per year, Brownsville homeowners incur the lowest housing costs. Other Texas cities where costs are less than $14,000 are Pharr ($13,824), Harlingen ($13,812), Wichita Falls ($13,728), Abilene ($13,704), Killeen ($13,608), and Bryan ($13,572).
Why should real estate agents care? The numbers offer comparative choices for buyers. All things being equal, having such data could be an important factor when choosing between homes in different cities. Would an undecided buyer, for example, appreciate knowing that housing costs vary in adjoining Bryan and College Station by $6,924? Perhaps. They likely would appreciate having the information.
The Center’s research used data on median homeowner costs, median homeowner incomes, and median home prices from the U.S. Census Bureau’s American Community Survey (ACS).
Among all U.S. states, Texas ranked:
- 18th in average annual homeowner costs,
- seventh in terms of homeowner costs as a percentage of home prices,
- tenth in amount of property taxes, and
- fifth in property tax as a percentage of home prices.
The research found a positive relationship between home prices and homeowners’ incomes and a negative relationship between home prices and homeowner costs.

Texas Homeowner Costs
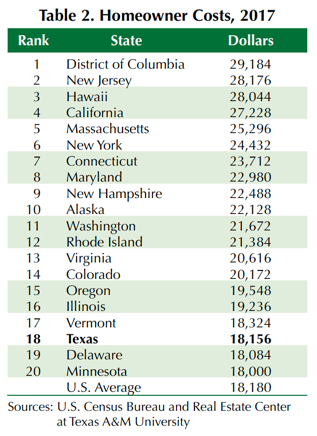
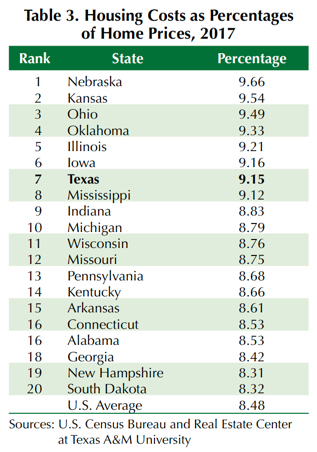
The ACS defines homeowner costs as the sum of payments for mortgages, deeds of trust, contracts to purchase, or similar debts on the property; real estate taxes; fire, hazard, and flood insurance on the property; and utilities. Median annual amount of housing costs spent by Texas homeowners in 2017 was $18,156, ranking the state 18th among U.S. states (Table 2). The ratio of Texas median homeowner costs to median home values was 9.15 percent, ranking Texas seventh (Table 3).
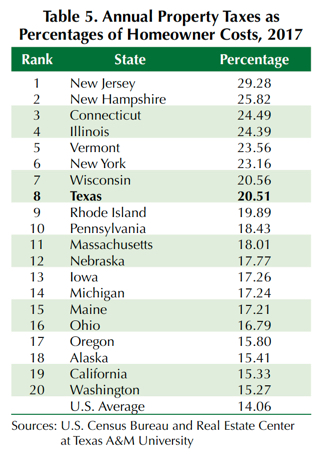
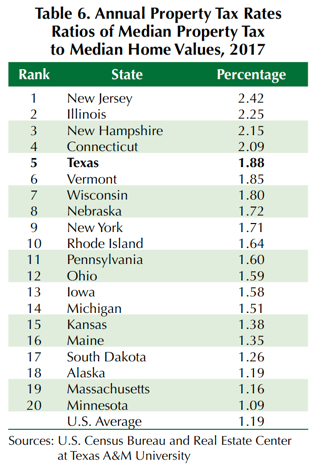
Property taxes imposed by cities, counties, and school districts are important components of the state’s housing costs given that Texas does not impose a state income tax and relies mainly on sales and property taxes for public finance. The state’s median property tax in Texas in 2017 was $3,724, ranking Texas tenth among states (Table 4). The median property tax accounted for 20.51 percent of the state’s median homeowner costs, ranking Texas eighth (Table 5). The median property tax as a percentage of median home value indicates an effective property tax rate of 1.88 percent, ranking Texas fifth (Table 6).

Homeowners’ Costs in Texas Cities
Harlingen had the highest homeowner costs as a percentage of median home values in 2017 followed by Mission, Pharr, Brownsville, Wichita Falls, and Beaumont (Table 7). Austin homeowners had the smallest ratio of housing costs to home values followed by Plano, Flower Mound, Frisco, Allen, and Richardson. The smaller ratios in these cities are mainly because of higher home prices due to higher homeowners’ incomes. The average of median ratios of housing costs to housing values for Texas cities was 9.15 percent.

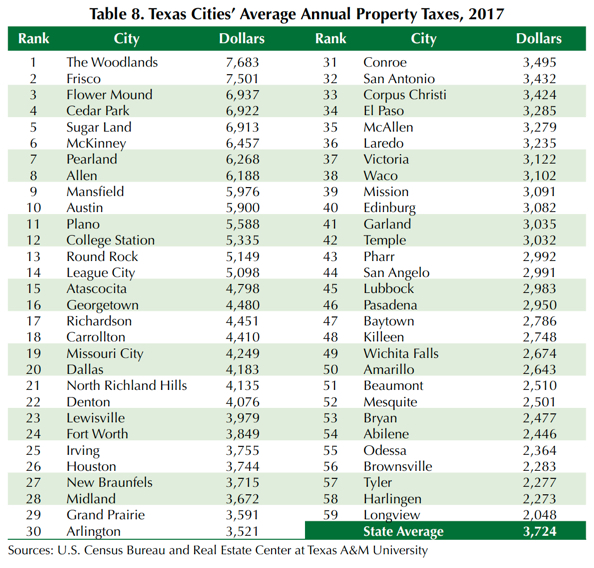
Property taxes also vary significantly across Texas cities. The Woodlands homeowners incurred the largest amount of property taxes in 2017 followed by Frisco, Flower Mound, Cedar Park, and Sugar Land (Table 8). Longview homeowners had the smallest amount of property taxes followed by Harlingen, Tyler, Brownsville, Odessa, and Abilene. The average annual property tax for Texas cities in 2017 was $3,724 (Table 8).
Property taxes accounted for 26.92 percent of housing costs in Cedar Park, the highest percentage in the state (Table 9). It was followed by The Woodlands, Mansfield, College Station, Pearland, and McKinney. Odessa had the smallest percentage of homeowner costs followed by Longview, Mesquite, Tyler, Harlingen, and Beaumont. The average percentage for Texas cities was 20.51 percent.

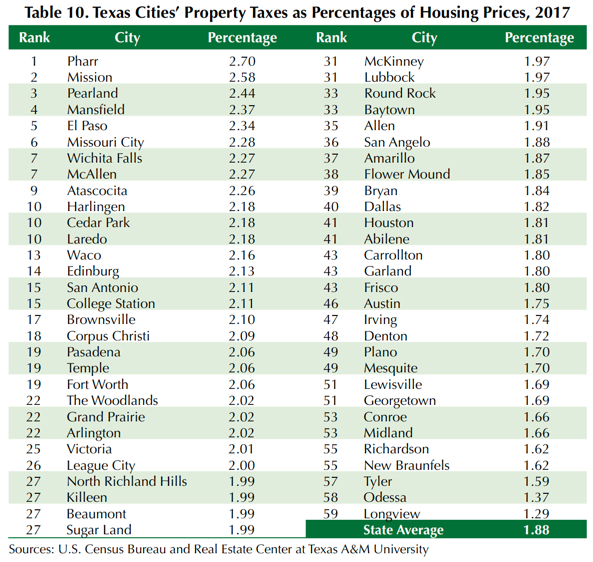
Pharr homeowners incurred the largest effective property tax rate (that is, property tax as a percentage of median home values) followed by Mission, Pearland, Mansfield, El Paso, and Missouri City (Table 10). Longview had the smallest rate followed by Odessa, Tyler, New Braunfels, Richardson, and Midland. The average effective property tax rate for Texas cities was 1.88 percent.
Home Values and Housing Costs
Homes are considered both consumption and investment goods. As an asset, home prices are the present values of expected future net cash flows from the property (net cash flow is rent income minus housing costs). Home prices are positively related to rents. That is, the higher (lower) the rental value, the higher (lower) the home values. However, home prices are negatively related to housing costs (the higher [lower] the housing costs, the lower [higher] the home values).
Whether a home is rented out or occupied by its owner, its rental value depends on the occupant’s income because rents are determined by the occupant’s willingness to pay a higher rent. That willingness depends on and is determined by the occupant’s income. For owner-occupied homes, ACS assumes homeowners rent their homes to themselves and estimates owners’ equivalent rent for home rental values. Home mortgage is another channel of the positive relation between home prices and homeowners’ incomes because the mortgage amount depends on a homeowner’s income.
Figure 1 shows a positive relationship between median home prices of 59 Texas cities and the median incomes of their owners in 2017. In other words, the higher the income, the higher the home value. Figure 2, meanwhile, shows a negative relationship between median home prices of the same Texas cities and homeowner costs as the percentages of home prices. That is, the larger (smaller) the percentages of homeowners’ costs, the lower (higher) the home values.
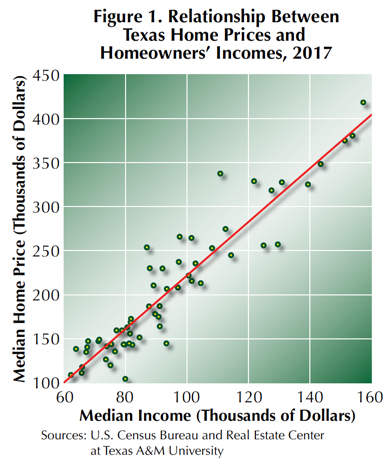
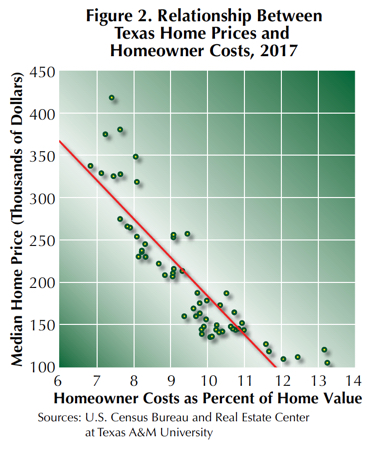
Using 2017 data, the Center estimated median home prices across Texas cities are 2.85 times homeowners’ median income minus $6,837 for each percentage of homeowner costs.
___________________
Dr. Anari ([email protected]) is a research economist with the Real Estate Center at Texas A&M University.
You might also like

TG Magazine
Check out the latest issue of our flagship publication.