


All’s Well When Oil’s Well


Midland’s economy is benefiting from the rebound in oil prices, and that translates into high demand for single-family and multifamily housing. Local employment is tighter than in any other Texas MSA, the population has enjoyed a growth spurt most of the last eight years, and the median household income is considerably higher than the state’s. |
The party is back on in the Permian as oil continues to rebound after busting in mid-2014. While optimists may say “this time is different," this oil cycle truly is in many ways. New technologies have boosted drilling efficiency in the oil patch providing American firms a competitive advantage in the global market even as oil prices gradually rise.
After a rough 2016, Midland’s economy has picked up where it left off before the bust. Employment is tighter than in any other Metropolitan Statistical Area (MSA) in the state. In August 2018, year-over-year total employment grew by a whopping 9.2 percent, a growth rate that had been maintained over the previous 12 months. Midland’s growth rate was significantly higher than both the state’s (closer to 3 percent) and the nation’s (close to 1.5 percent). Just as impressive was the unemployment rate, which was in the lower 2 percent range for most of 2018.
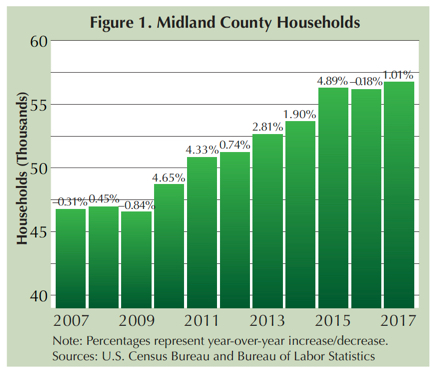
With such a tight job market, local population and income growth were sure to follow. U.S. Census Bureau estimates show a growth spurt in the number of households from 2010 until 2015, when growth began to plateau (Figure 1). The largest growth years were 2010, 2011, and 2015. In each of these years, year-over-year growth exceeded 4 percent. In 2016, the slowdown in the number of new households was almost in sync with the slowdown in oil.
Median household income from 2010 to 2017 grew 42 percent to $75,590, and that was after falling from $81,064 in 2015 (Figure 2). Even after that drop, Midland’s income level was considerably higher than the state’s, which was $59,206.

Housing Bounces Back
In response to rapid population growth and rising income, home sales volume bounced back in 2017 with 2,774 home sales, a 34 percent jump over 2016. September 2018 year-to-date (YTD) sales were at 2,139, ahead of September 2017’s YTD level of 2,095 and on pace to exceed 2017 year-end levels.
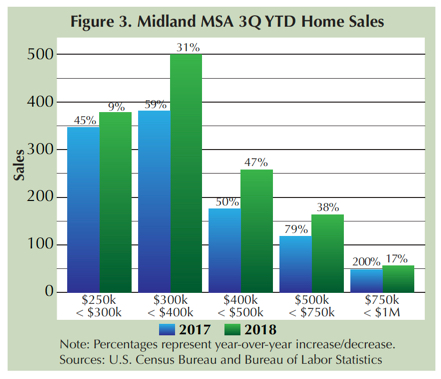
Homes priced from $300,000 to $1 million led the charge in sales growth (Figure 3). September YTD sales for homes priced in the $400,000s were at 258, up almost 50 percent from September 2017 and already eclipsing year-end 2017 sales of 245.
Market conditions going into fourth quarter 2018 only got tighter. Months inventory of homes for sale was still below two months. Average days on market dropped to 31 days for most of 2018 from 48 days for most of 2017. Sluggish new-home construction activity indicates this tight supply is not going to be alleviated anytime soon. YTD September new construction sales, through the Multiple Listing Service at least, were below 2017 YTD levels, and new permits were also in decline.
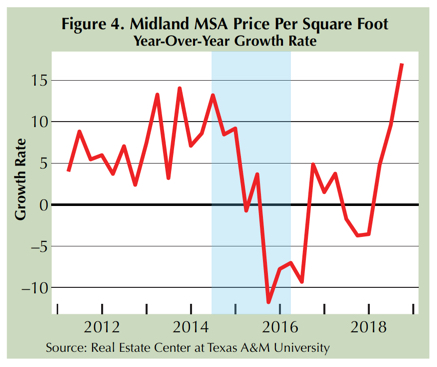
Given market pressures from both supply and demand, median price and price per square foot (PSF) have risen sharply over the past year and a half. Figure 4 illustrates the change in median price PSF during the latest oil cycle. Monthly oil prices peaked late in second quarter 2014, the same time the growth rate in median price PSF fell. Oil prices hit bottom during first quarter 2016. Price PSF sputtered for a few additional quarters but picked up shortly afterward.
A similar trend appears when using the Real Estate Center’s home price index (HPI) model (Figure 5). Unlike the median price PSF metric, the HPI index aggregates the growth rate between sales. From early 2012 to year-end 2014, the index grew from 100 to 123, inferring gradually higher rates of home appreciation. According to the index, price growth peaked slightly after the fall in median price PSF (Figure 4). However, troughs for both occurred in early 2016 before starting a new high-growth trend.

The single-family housing market is not the only one being squeezed. Midland, along with neighboring Odessa, currently has one of the hottest apartment markets in the state. According to ALN Apartment Data, September 2018 effective rent in the Midland apartment market was approximately $1,604, a 29 percent annual increase. In September 2017, the effective rent was estimated at $1,241, almost 30 percent more than the year before.
Given the current energy climate, the housing market is expected to remain tight. Numerous major pipeline projects have been announced that should help with supply bottlenecks that have been the bane to increased Permian production. Declining exports in Iranian and Venezuelan oil have also recently helped boost petroleum prices. As long as oil continues to do well, expect Midland to follow suit.
____________________
Roberson ([email protected]) is a senior data analyst with the Real Estate Center at Texas A&M University.
You might also like

TG Magazine
Check out the latest issue of our flagship publication.