


Economic indicators along the border were mixed in fourth quarter 2023. Border employment grew and the unemployment rate fell; however, average hourly wages also fell due to declines in both El Paso and Brownsville.
Housing sales are still down from last year, but home prices remain elevated. Inflation also continued to cool as the Federal Reserve’s interest rate increases showed more impact. Data showed that while inflation is still well above the Fed’s inflation target, it is showing continuing signs of decelerating.
Economy
El Paso led the border metros this quarter in general economic output according to the Dallas Fed’s Business-Cycle Index. The other three metros reported stagnant output during this time. Over the past year, El Paso and Brownsville had strong growth, with rates of 3.4 and 7.2 percent year-over-year (YOY), respectively. Laredo also grew but at a much slower pace of 1.7 percent while McAllen’s growth has been relatively flat, below 1 percent.
Overall, border MSA nonfarm employment added 3,800 positions, resulting in a 0.4 percent quarter-over-quarter (QOQ) growth rate with minor growth recorded in each of the four border metros (Table 1). The border-wide unemployment rate fell 30 basis points to 5.1 percent in fourth quarter 2023. Joblessness fell the most in Brownsville-Harlingen with the unemployment rate dropping 40 basis points down to 5.3 percent.
Border average hourly earnings fell 32 cents reaching $21.20. The dip in earnings was influenced heavily by a $1.07 plunge in El Paso’s hourly wages during the latest quarter. Laredo also experienced a relatively large decline in wages, falling 74 cents to $21.42.
Pedestrian border crossings grew by an impressive 8.5 percent QOQ and 21.5 percent YOY, reaching 4.4 million crossings in fourth quarter 2023. Despite the rapid climb in pedestrian crossings, the latest quarter is still far below fourth quarter 2019 levels of 5.2 million. Personal vehicle passengers also grew but at a much slower pace, recording only a 0.62 percent QOQ increase and a 1.2 percent YOY increase.

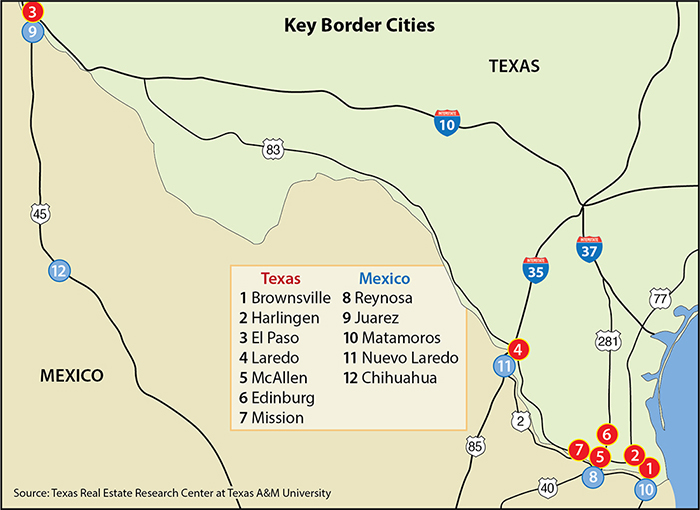
On the southern side of the border, Mexican manufacturing and maquiladora employment1 continues to fall after peaking in 2Q2023 (Table 2). The biggest contributor to this loss comes from Juárez’s decrease in employment with nearly 20,000 manufacturing jobs lost since the second quarter. Reynosa and Matamoros have also lost jobs over the same period but to a much lesser extent.

In the currency market, the peso per dollar exchange rate was relatively unchanged in the fourth quarter with the U.S. dollar losing only about $0.12 on the Mexican peso. The past two quarters have been relatively quiet compared to the two quarters before when the dollar lost over $2 in value against the peso.
Border trade ended the year on a weak quarter with both imports and exports declining. Total border imports fell $1.8 billion (2.6 percent QOQ), while total exports fell $400 million (1.7 percent QOQ). Even with the down quarter for border trade, overall U.S. trade activity is still on the rise with imports continuing to edge out exports, contributing to the rising trade deficit of $23.6 billion.
Real Estate
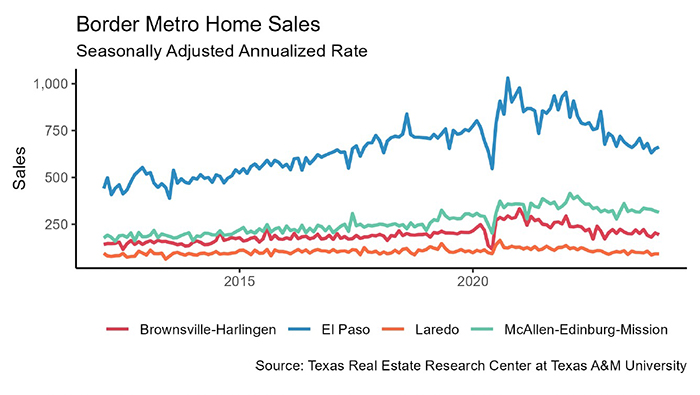
Home sales continued to decline with fourth quarter sales dipping to 3,547 (Table 3). This time last year home sales were 3,766 indicating a 5.8 percent YOY drop. Sales have fallen in each of the four border metros while listing counts have increased. The result has been a ubiquitous rise in housing inventory levels, which has led to stalling aggregate home price growth.

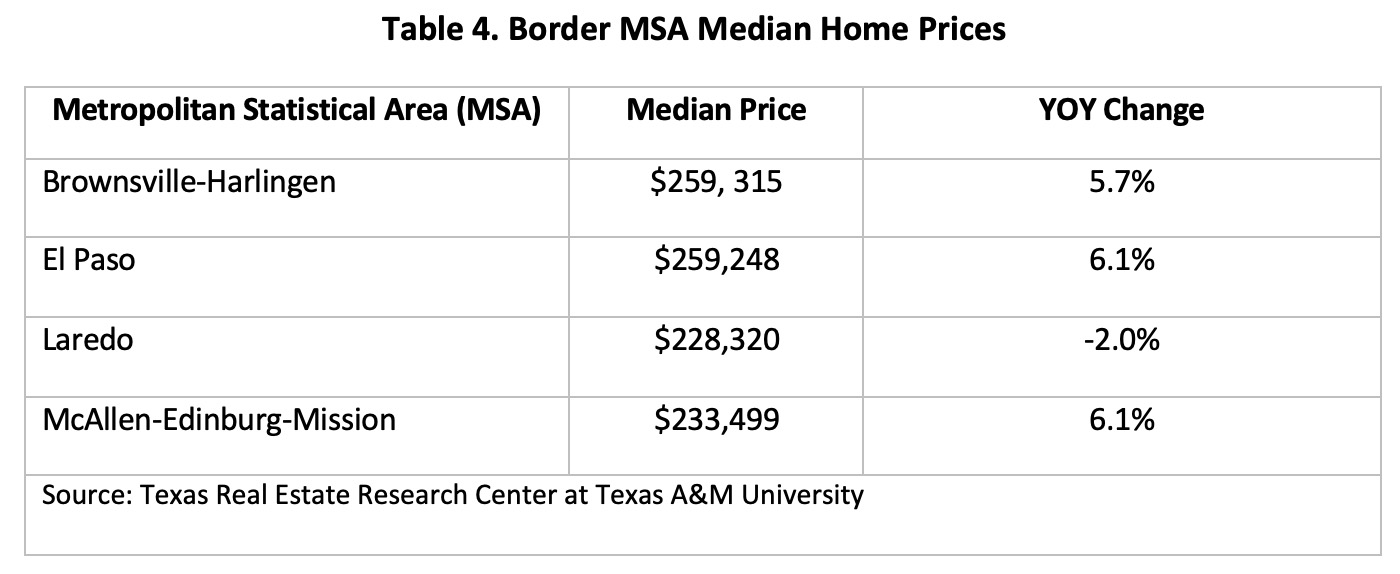
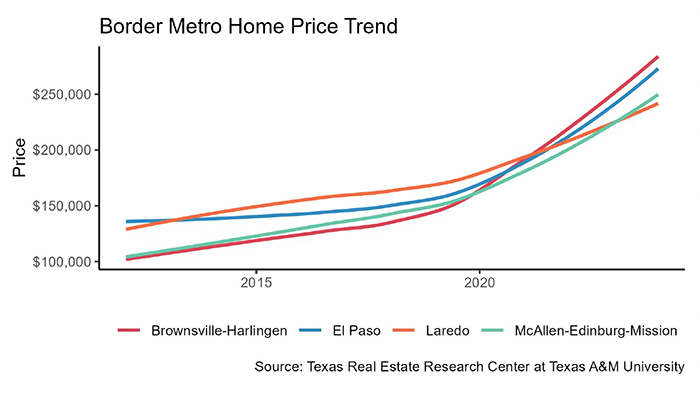
The median home price throughout the border has been hovering around $250,000 since 2Q2023 (Table 4). Three out of four border metros grew compared to last year with both El Paso and McAllen increasing 6.1 percent YOY and Brownsville trailing closely behind at 5.7. Laredo recorded a minor dip in price with a -2 percent YOY rate.
____________________
1 Mexican manufacturing and maquiladora employment is generated by the Instituto Nacional de Estadística y Geografía.


To view the entire report, click the download button.
To see the previous report, click here. For the report from a year ago, click here.
Previous reports available with data from:
You might also like

TG Magazine
Check out the latest issue of our flagship publication.