


Initial Report on a Survey of Residential Land and Housing Development Fees in Texas


Executive Summary
Housing affordability is of growing concern across Texas and beyond. Many things have the potential to drive up housing costs, including increasing materials costs, increasing labor costs, more stringent building standards, increasingly binding zoning constraints, and more. The increasing number of fees by local municipalities is commonly cited as one driver burdening residential land and housing development. However, the data on fees are dispersed and piecemeal, making this complaint difficult to verify.
Other reports cover the range of one particular fee across jurisdictions or the total fees charged for one particular development in one particular jurisdiction. This report seeks to explore all fees charged by Texas municipalities through the housing development process, and how those fees vary across development characteristics. This report covers select municipalities in the Austin metropolitan area as well as the five largest municipalities in the state.
Fees the selected municipalities charge to new single-family residential developments were surveyed and applied to two development models to discover the total fee charged per housing unit and how they vary across municipalities and development types (Table 1). These fees vary across municipalities, with the maximum total fees for the two development models coming in at almost two and almost three times greater than the average fee. Furthermore, the per-unit housing fees increase as the development becomes smaller. This is expected to some extent due to the fixed-cost nature of some of the reviews municipalities undertake. The per-unit housing costs increase 4 percent to 120 percent across the municipalities when moving from the larger suburban-style development to the smaller infill-style development.

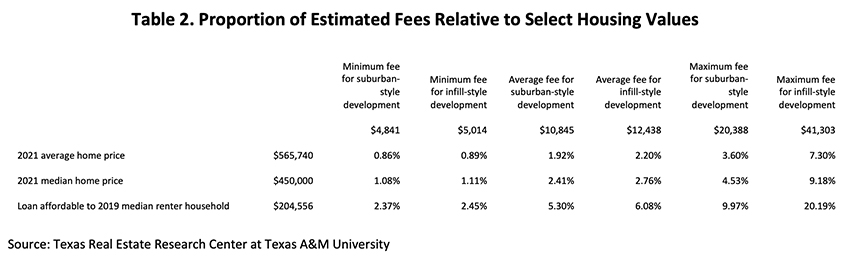
The 2021 average and median house price in greater Austin was $565,740 and $450,000, respectively, while the median income of renter households in the area would allow them to afford a loan of up to $204,556 under some standard assumptions of affordability. Fees charged by the selected municipalities range from 2.02 percent to 17.42 percent of the loan that the median Austin area renter may have been able to afford in 2019, as illustrated in Table 2.
This report provides the results of a survey of the explicit fees charged by local municipalities through the housing development process. It does not attempt to answer the question of what individual or total fee is appropriate. Furthermore, the explicit fees may not be the complete accounting of the total governmental costs in every city. Some city departments involved are enterprise-funded and recoup the total costs. The City of Austin’s development and planning department is one of these. Other cities use additional revenue sources to fund the compliance review of new residential development. An additional consideration may be that the regulations and their review process have benefits such as ensuring safer housing, public resource protection, and flood control. These are not considered here. This initial report provides a starting point for further investigation into these more comprehensive questions as well as providing the data.
Introduction
There is a remarkable lack of comprehensive information on local government’s role in Texas’ housing development process. This limits the ability of researchers, the public, and municipalities to understand the full role individual municipalities play in the process or compare the policies and choices that voters make. Furthermore, without data within a single municipality or across municipalities, it is impossible to analyze the impacts that the potential policies may have.
Housing is another pertinent issue across Texas and beyond. Many things have the potential to drive up housing costs, including increasing materials costs, increasing labor costs, more stringent building standards, increasingly binding zoning constraints, and more. An increasing number or level of fees by local municipalities is commonly cited as one driver burdening residential land and housing development. However, the data on fees are dispersed and piecemeal, making this complaint difficult to verify.
Other reports have covered the range of one particular fee across jurisdictions or the total fees charged for one particular development in one particular jurisdiction. This report explores all fees charged by Texas municipalities and how those fees vary across development characteristics. It surveys the information available online from select municipalities in the Austin metropolitan area as well as the five largest municipalities in the state.
Common economic justifications for the role municipalities play in the residential land and housing development process include preventing or charging for negative externalities and dealing with concerns about asymmetric information. Cost recovery is a common justification for high fees and for charging those who would benefit from or be the cause of the negative externality that the municipality seeks to prevent or limit.
Building inspections and permitting are textbook responses to the potential for asymmetric information problems. In the absence of inspections, a builder or electrician could cut corners, and it would be difficult for a buyer to verify once the sheetrock goes up. Through the permitting system, the buyer can be more confident that construction quality at least meets the municipality’s standard. Comprehensive planning and zoning systems typically are justified as preventing certain uses from locating near each other if those incompatible uses could hinder the enjoyment of the neighboring parcels. Regardless of whether a particular regulation is economically or in any other way justified, its enforcement comes at a cost. This report covers regulations in which costs are passed onto the developer, builder, and consumer of residential housing and land in the form of explicit fees. The appropriate fee level is neither determined nor suggested. That question would require much further study. This is only the first step.
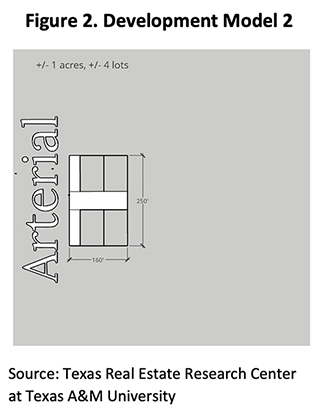
Two model residential developments are proposed to explore the variation in fees across municipalities and how those fees can change depending on the scale of development. Model 1 has the characteristics of a large-scale development often seen along the boundaries of current distribution of population at the suburban fringe. It will have +/- 40 acres yielding +/- 200 lots and homes (Figure 1). Model 2 is on a smaller scale. It will subdivide a lot of +/- one acre into +/- four lots and homes (Figure 2). With just one starting acre, this model is meant to be typical of an infill development one might find closer to town on land that has already undergone one or more development phases as a city has grown.

Municipalities’ fee bases are not related solely to the land area of the total development or to the final lot yield. Models 1 and 2 require further assumptions through the development process. For example, the square footage of the structures to be built is a common basis for the fees related to building permits. Under both models, the final structures are assumed to be 1,500 square feet. Further assumptions need to be made about the characteristics of the structures, but also about the size of water connections, infrastructure length, square footage of impervious cover, etc. Table 3 lists the basis on which fees are charged and the assumptions made for this exercise. The assumptions are meant to be reasonable but are not based on specific calculations or plans. Finally, both models assume the land to be developed is along an existing arterial roadway with all utilities present at the edge of the site. Only those fees directly involved in development, infrastructure, and other activity on site are explored here.
Development of new housing goes through a few typical, broadly defined stages between ideation and new households moving into the units. Fees were first classified among eight broad stages of a typical residential land development process through which municipalities typically charge development fees: comprehensive planning update applications, zoning changes, subdivision and platting of land, site plan applications, building permitting, tap fees, and impact fees. In addition, municipalities often charge fees in lieu of parkland dedication, which were assumed to be paid as opposed to the requirements for in-kind dedications for on-site parkland, when available.
For each municipality, information on fees charged, the base and per-unit value of the fee, and the basis of each fee were collected and compiled into a fee sheet (see appendix).1 Each fee sheet contains all the municipality’s identified fees potentially applicable to single-family residential development. Columns 1 through 3 show the development stage of the fee, name of the fee, and basis on which the fee is charged. Columns 4 and 5 keep track of the multipliers that must be charged depending on the fee basis for Model Development 1. Columns 8 and 9 keep track of the same for Model Development 2. Columns 6 and 10 are the per-basis-unit charge for each fee. Columns 7 and 11 are the total charge for Development Models 1 and 2, respectively, for each fee.
Results
Using data summarized from the individual fee sheets, Table 4 shows each municipality’s estimated fees by development stage and/or fee type as well as the total fees for Model 1. Table 5 presents the same but divides the total and subgroup fees by the number of final housing units to put it on a per-housing-unit basis. The average per-housing-unit total fee charged by the municipalities covered here is $10,707, with a range between $4,841 and $20,388. Each fee subcategory tracked also shows significant variation in the fee charged per housing unit. The average multiple between the maximum fee and the average fee by subcategory is five, while the multiple between the average and maximum total fee is closer to two. There is greater variance within fee categories than in total fees. Table 6 illustrates the ratio of each fee category in each municipality to the average fee by category. This illustrates the peril of comparing municipal costs across only one category. For example, Round Rock charges 21 percent of the average zoning fees while charging 147 percent of the average impact fee and almost perfectly average total fees, at 95 percent. Almost none of the cities are consistently below or above average across all categories.
Tables 7 and 8 show more variable results for development Model 2. The average per-housing-unit total fee ranges between $5,014 and $41,303with an average of $12,438. The average multiple between the average fee and the maximum fee for each subcategory for Model 2 developments is also approximately five here. A similar pattern, as in Model 1, also holds when comparing the ratios between fees by category by city and the average by category as illustrated in Table 9.
Model 2 housing units are also consistently charged more per housing unit than those in a Model 1-type development. This is easily explained by fixed costs baked into the process of development and construction review and reflected in the fees municipalities charge. Some aspects of zoning, design and plan review, etc., do not depend on the size of the development, and they take the same labor hours whether the development is one acre or 40, or four lots or 200. Municipalities charged the Model 2 development an average of 24 percent more in per-housing-unit fees than they did Model 1. Austin has the most extreme ratio between their Model 1 and Model 2 per-housing-unit fees at 2.27 times. Mathematically, this is due to the larger reliance on base fees rather than marginal fees related to the size of the development.
Relation to Home Prices
The average price of a single-family home in the Austin metropolitan area in 2021 was $565,740, while the median price was $450,000.2 Households renting in the Austin area in 2019 had a median income3 of $54,871, which under some affordability metrics4 may allow them to afford a loan of up to $204,556. The average per-housing-unit fee for large developments ($10,845) was 1.92 percent and 2.41 percent of the 2021 average and median Austin metropolitan area home price, respectively. It was 5.30 percent of the price affordable to the median Austin renter household in 2019 (Table 10). The maximum fee for the large development model ($20,388) represents 3.6 percent and 4.53 percent of the average and median home price in 2021, respectively, and 9.97 percent of the purchase price of a home that was affordable to the median 2019 Austin area renter household.
All surveyed municipalities charge slightly higher rates per housing unit on smaller developments. The maximum per-housing-unit fee identified in this study ($41,303) ranges from 7.30 percent of the average price of an Austin home in 2021 to 20.19 percent of the price that may be affordable to a 2019 Austin renter household.
Conclusion
Despite collecting more comprehensive data across municipalities and development types, this report narrowly explores the explicit dollar value charged to residential land and housing development. The modelling here does not account for difficulties that may occur in following municipalities processes. In reality, each step may need to be repeated, and separate fees may be charged for each iteration. Furthermore, the time municipalities take for their review and application iterations, while necessary, will increase financing costs for new housing. The development models are roughly based on yields of 5,000-square-foot lots of single-family home development, which may or may not be an “acceptable" development pattern within a municipality’s zoning ordinance. Even where this development pattern is technically acceptable under some classification within the zoning ordinance, approval of the rezoning is not a given as assumed in this report.
There is also a difficulty that the explicit fees charged may not cover the whole cost of the regulatory compliance process. While some planning, development, and building departments are enterprise-funded, such as the City of Austin’s, not all are. In as much as one believed that the development process should be set up as a user-pay system, some may interpret this as a subsidy. But it leads to the report apparently overstating the total costs of the more fully self-funded departments relative to the costs of the departments receiving a larger portion of their funding from general revenue or other sources.
In economics and policy discussions, cost should always be balanced by benefits. This report does not attempt to explore the potential benefits of varying regulations or the varying levels of enforcement that may drive some of the variation in fees charged between municipalities. The potential benefits of the regulations involved here range from safer housing to public resource preservation to flood control and beyond. These benefits should be weighed against the costs of providing them when voters and policy makers decide on the appropriate mix for their community. This initial report provides a starting point for these discussion by providing data on what the fees charged to new developments amount to.
____________________
The author submitted the findings of this report to the various municipalities to check for accuracy and completeness and to provide general comments.
1 While the researchers put forth a good faith effort to gather all pertinent data and accurately report the findings, the data reported here for the individual municipalities’ fees should not be relied upon in estimating costs for any particular development in any particular municipality. The data was initially collected through publicly available data on municipal websites by the researchers between June of 2021 and December of 2021. Fees are typically updated every year. Please reach out to your local municipality with any development plans. Pre-submittal meetings are commonly offered to go over the precise rules and fees that your development may have to follow.
2 https://www.recenter.tamu.edu/data/housing-activity/#!/activity/MSA/Austin-Round_Rock
3 2019: ACS 1-Year Estimates, MEDIAN HOUSEHOLD INCOME THE PAST 12 MONTHS (IN 2019 INFLATION-ADJUSTED DOLLARS) BY TENURE
4 35% or less of monthly income spent on PITI with 360 payments at 3.5% interest, 3% property tax and 1% annual insurance.
To access this 66 page report in its entirety, use the download button below.
You might also like

TG Magazine
Check out the latest issue of our flagship publication.