


2020 Texas Employment Data Revision Highlights


As more accurate time series of employment data become available, the U.S. Bureau of Labor Statistics and the Texas Workforce Commission revise previously published time series of employment for U.S. and Texas. This improves the accuracy and quality of job datasets. These revisions can significantly affect the trajectories of levels and job growth rates in U.S. and Texas industries, as well as in Texas Metropolitan Statistical Areas (MSAs), so it’s important to review and monitor the times series of employment data before and after the revisions.
The Real Estate Center’s analysis shows pre-2018 employment data series have not changed significantly. Consequently, this article compares 2018-19 employment growth rate data from before and after the latest revisions.
Impact on Texas Total Nonfarm Jobs
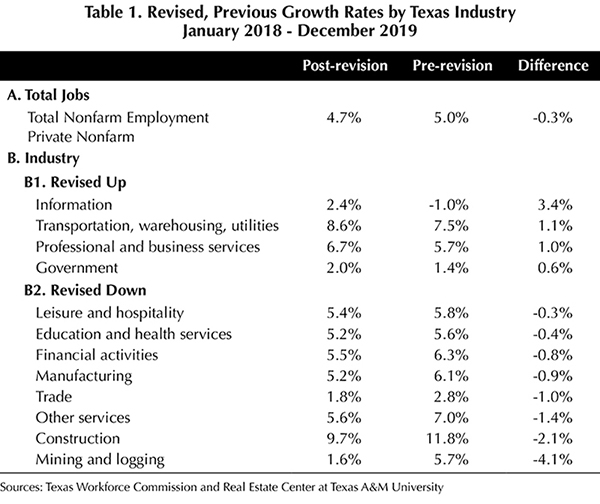
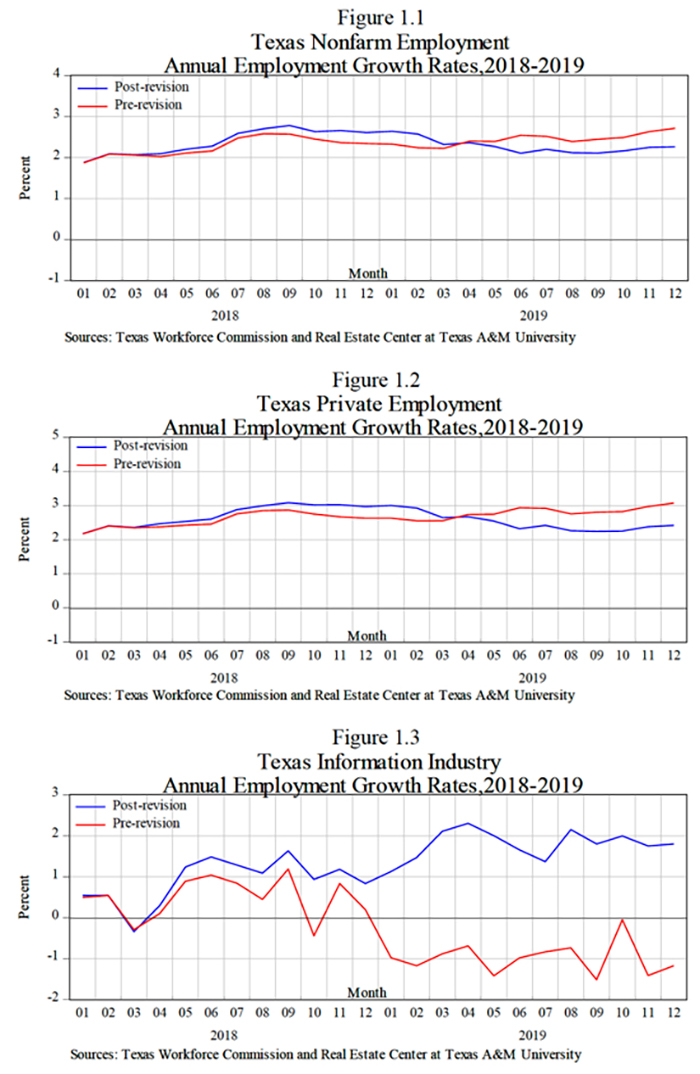
The growth rate of Texas nonagricultural employment from January 2018 to December 2019 was revised down from 5 percent to 4.7 percent (Table 1, Panel A). The growth rate of total nonagricultural jobs was revised up from March 2018 to March 2019 and revised down for the rest of 2019 (Figure 1.1). Texas private employment from January 2018 to December 2019 was revised down from 5.7 to 5.3 percent. Total nongovernment jobs were revised up from March 2018 to April 2019 and revised down from April to December 2019 (Figure 1.2).
Impact on Texas Industries
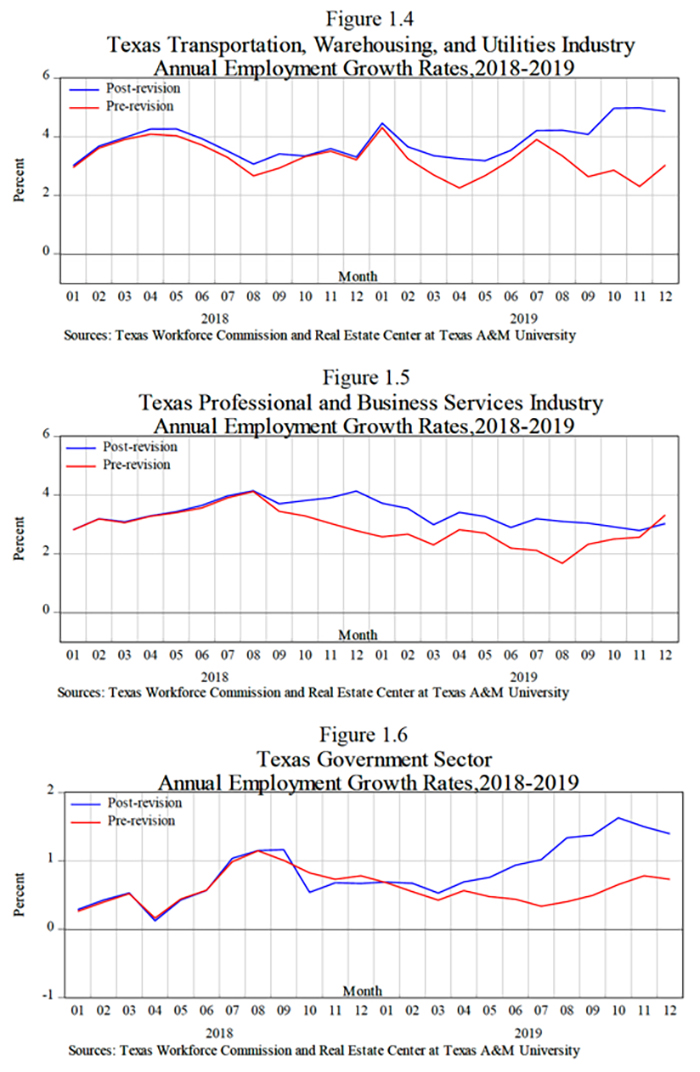
Annual employment growth rates for three Texas industries and the state’s government sector were revised upward (Table 1, Panel B1). The state’s information industry had the largest upward revision followed by transportation, warehousing, and utilities; professional and business services; and the government sector.
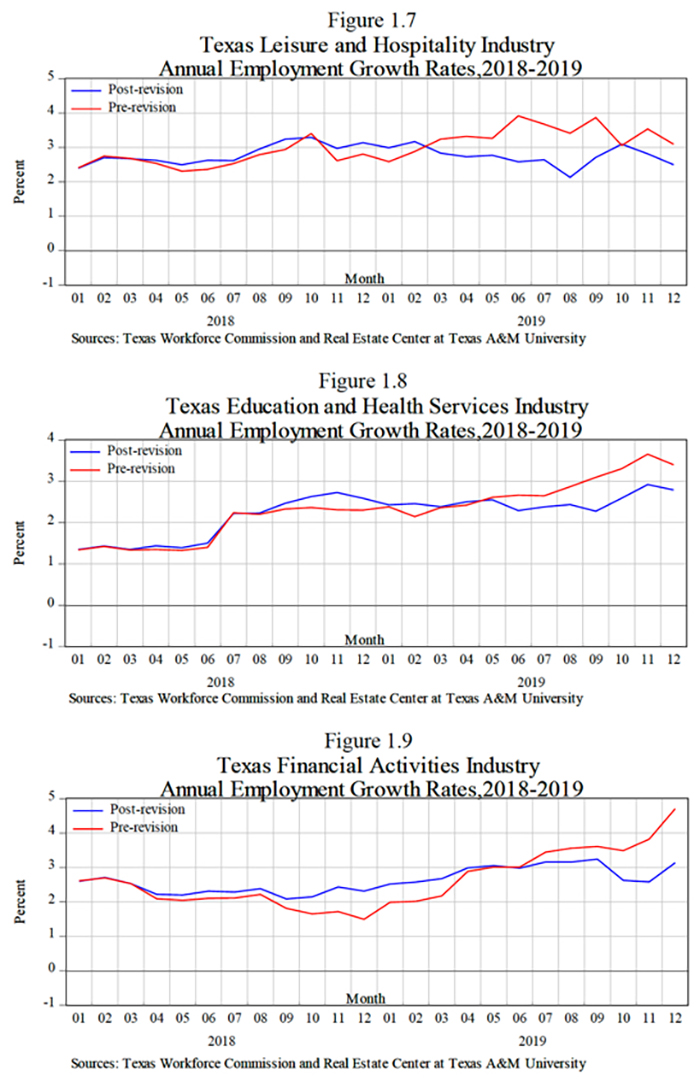
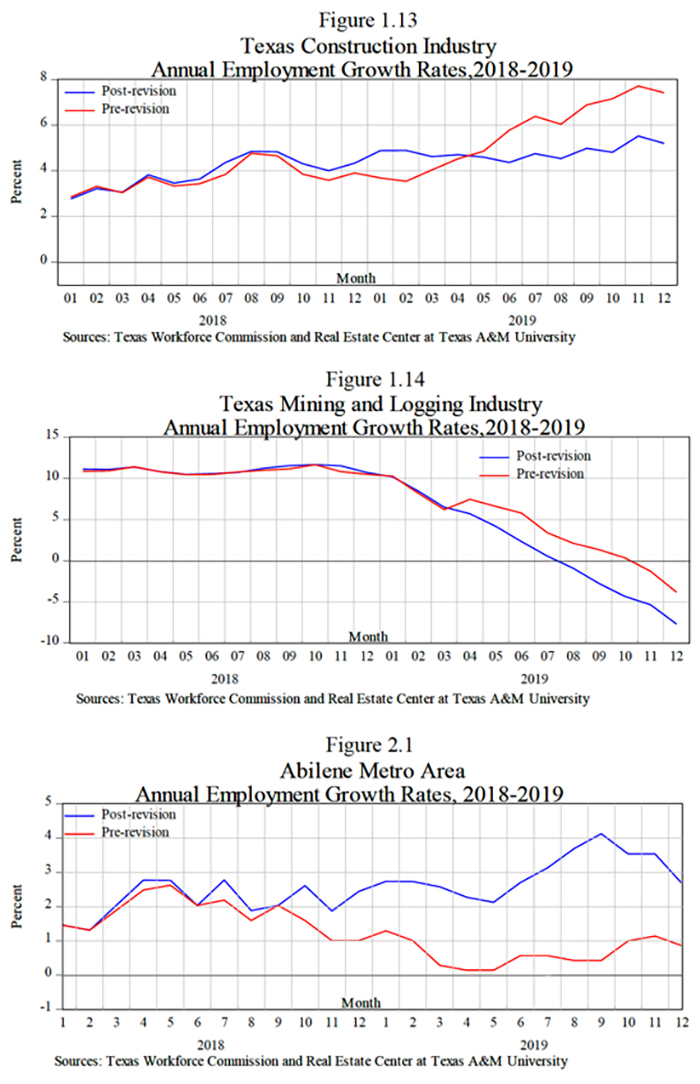
Job growth rates in eight Texas industries were revised down (Table 1, Panel B2). Mining and logging had the largest downward revision followed by construction, other services industries, trade, manufacturing, financial activities, education and health services, and leisure and hospitality. See Figures 1.3-1.14 for 2018-19 employment growth rates by Texas industry.
Impact on Texas Metros
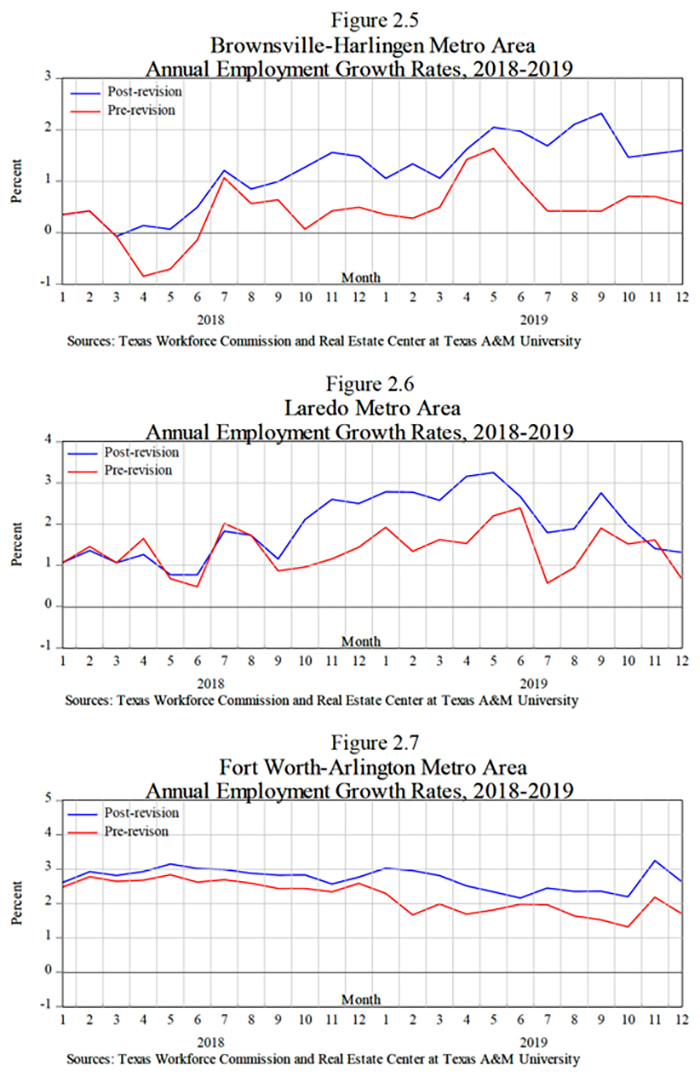
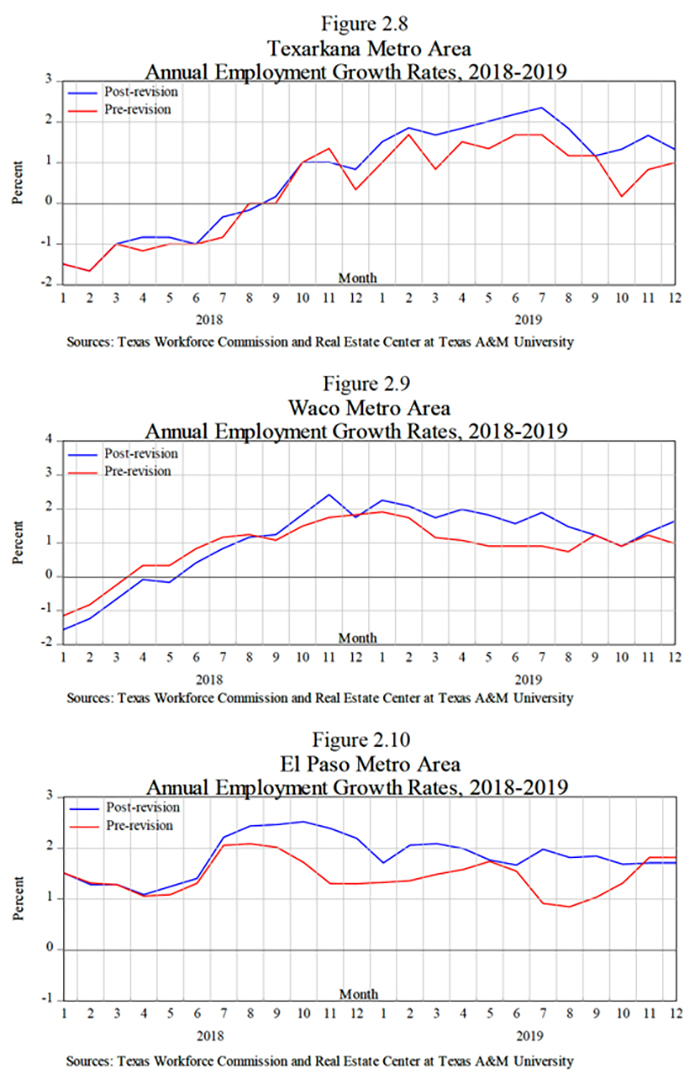
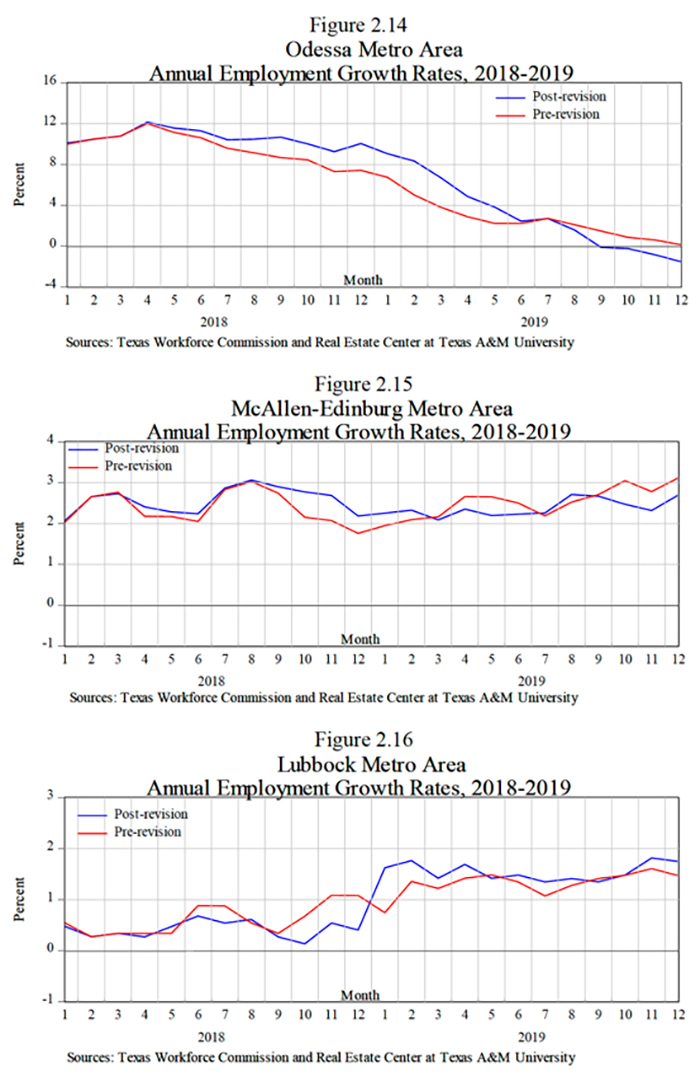
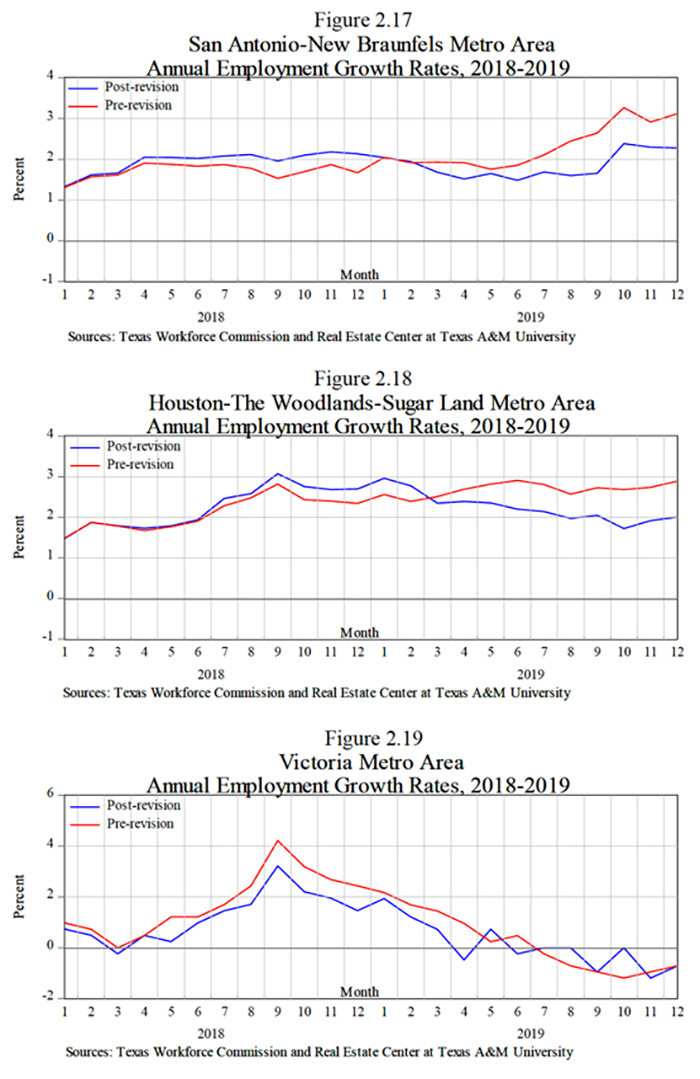
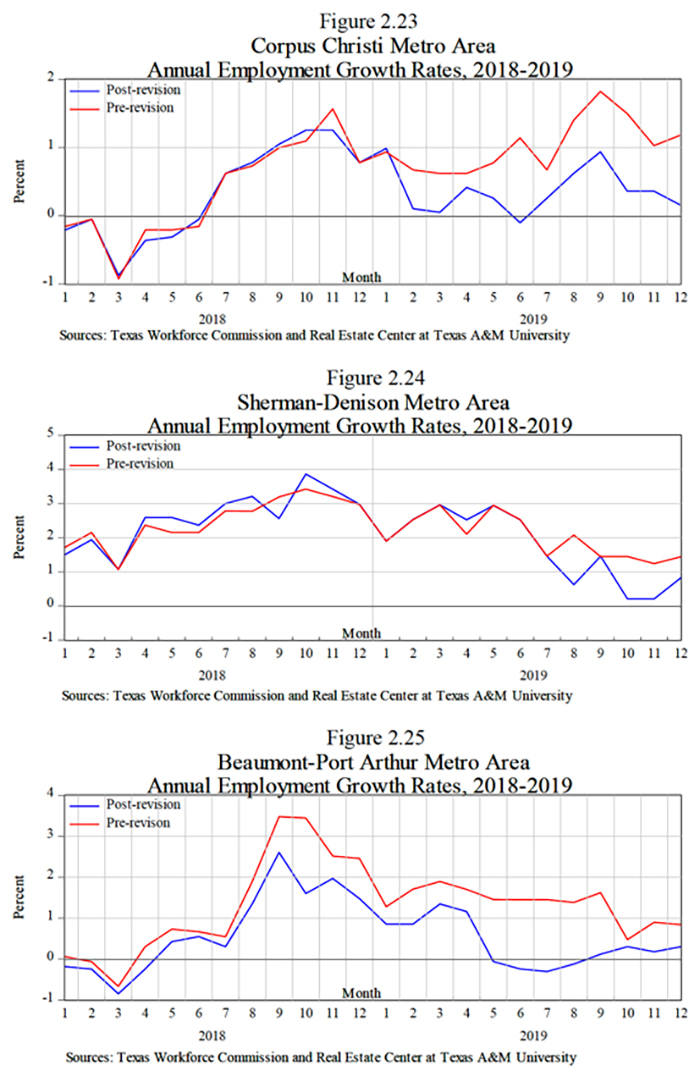
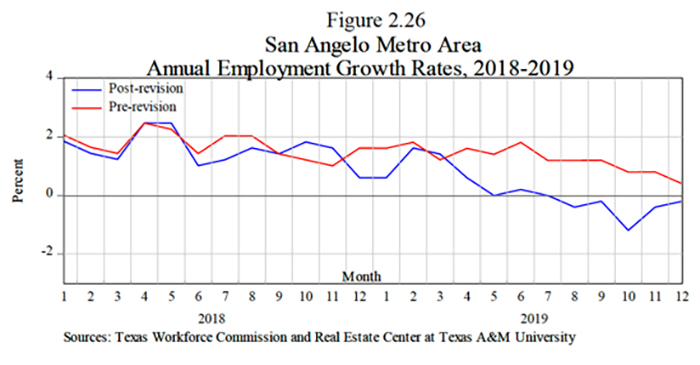
Job growth rates were revised upward in 14 MSAs (Table 2, Panel A1). Abilene had the largest upward revision followed by Longview, Midland, Austin-Round Rock, Brownsville-Harlingen, Laredo, Fort Worth-Arlington, Texarkana, Waco, El Paso, Amarillo, College Station-Bryan, Wichita Falls, and Odessa. Twelve MSAs had downward revisions (Table 2, Panel B2). San Angelo had the largest followed by Beaumont-Port Arthur, Sherman-Denison, Corpus Christi, Dallas-Plano-Irving, Killeen-Temple, Texarkana, Victoria, Houston-The Woodlands-Sugar Land, San Antonio, Lubbock, and McAllen-Edinburg-Mission. See Figures 2.1-2.26 for 2018-19 employment growth rates by Texas MSA.


_______________
Dr. Anari ([email protected]) is a research economist with the Real Estate Center at Texas A&M University.
You might also like

TG Magazine
Check out the latest issue of our flagship publication.