


Finding a Representative Interest Rate for the Typical Texas Mortgagee


Note: Data were current at the time this report was written.
 The Federal Home Loan Mortgage Corporation’s (Freddie Mac) 30-year fixed rate is widely considered the national benchmark for home-purchase mortgage interest rates. The primary mortgage market survey used to calculate that rate is not limited to loans directly purchased by a government-sponsored enterprise (GSE) (i.e., Freddie Mac and Fannie Mae).
According to Freddie Mac, the rate is calculated as a weighted average of the current dollar volume of the loan originations. The types of lenders (thrifts, credit unions, commercial banks, and mortgage lending companies) surveyed are roughly proportional to the level of mortgage business that each type originates nationwide. This accounts for the size of the loan and type of lending institution.
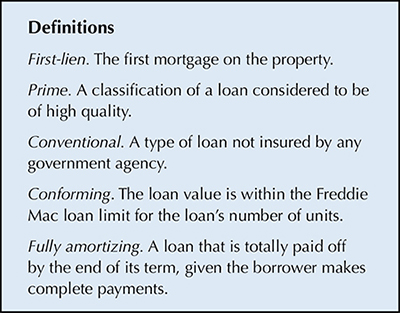
The 30-year mortgage survey restricts its sample to first-lien, prime, conventional, conforming, and fully amortizing home-purchase loans for borrowers who make a 20 percent down payment and who have “excellent credit," which anecdotally includes credit scores of 750 and higher.
While the Freddie Mac survey rate is a good measure in the sense that it holds the loan product, loan purpose, and borrower profile constant to exclude composition effects and has a margin of error of about 0.05 percent, it is not representative of the rate offered to the general population.
This study provides a more representative mortgage interest rate for the typical Texas mortgagee than Freddie Mac’s survey rate. Building on Freddie Mac’s national benchmark, two separate Texas mortgage rates were calculated: one for GSE and another for non-GSE borrowers. These mortgage rates are calculated from a wider sample because the national rate applies to only 13 percent of borrowers in Texas under Freddie Mac survey constraints (Table 1). These data profiles are useful to potential homebuyers, lenders, economists, and the real estate industry in general because they fill the information gap left behind from the Federal Housing Finance Agency’s discontinuation of its Monthly Interest Rate Survey and they supply unique information about the Texas borrower.
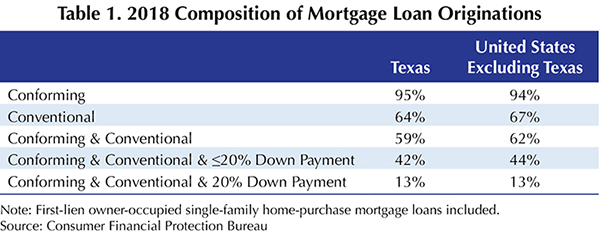
Table 1 breaks down the percentage of originations that meet Freddie Mac’s benchmark conditions. Requirements for conventional loans and down payment conditions are the greatest limiting factors in the Freddie Mac survey. For example, nearly all loans originated in Texas during 2018 were conforming, but less than 60 percent were both conforming and conventional. Only 13 percent of all Home Mortgage Disclosure Act (HMDA) loans had a down payment of 20 percent in addition to being conforming and conventional loans.
Along with issues of generalizability, lender discretion in classifying application quality complicates the interpretation of the benchmark rate. For instance, each lender has his own criteria for “excellent" credit. Similarly, the stipulations a borrower must meet to be considered for a prime mortgage may vary from lender to lender. These loosely defined parameters add a component of uncertainty to the survey. Stringent credit and down payment requirements bias Freddie Mac’s 30-year fixed mortgage rate toward only the top tier of mortgage applicants.
To circumvent this issue, the Real Estate Center uses CoreLogic’s TrueStandings Servicing loan-level data to derive an interest rate that better represents what the “typical" Texas mortgagee would observe. Following Freddie Mac’s benchmark, home loans must be first-lien and for fixed 30-year terms. The Center distinguishes between borrowers who take out GSE and non-GSE loans due to fundamental differences in their characteristics. For one, GSE borrowers usually have lower credit scores than non-GSE borrowers, resulting in higher interest rates.
However, all TrueStandings Servicing loans have a missing data field for the credit score attribute for GSE loans. Therefore, only the loan-to-value ratio (LTV) and back-end debt-to-income ratio (DTI) can be accounted for in the GSE analysis. Moreover, in the years immediately following the housing crisis, GSE borrowers had lower LTV and DTI ratios than non-GSE borrowers. Beginning in 2018-19, however, non-GSE and GSE values for both metrics started to converge. For the non-GSE rate, the Center restricts its sample to loans with a defined credit score, LTV, and DTI. One or more of these fields may be undefined due to the lender not supplying the information to TrueStandings Servicing.
For each origination period, a value for DTI, LTV, credit score, and average loan balance is calculated using a weighted average based on the loan amount to determine the typical Texas mortgage. Values for these attributes fluctuate from month to month. Table 2 provides a snapshot of the data profiles from April 2020. The sample was limited to fixed 30-year term loans, which accounted for nearly 90 percent of 2019 originations. This was not always the case, however. The share of fixed 30-year-term loans was just 66 and 72 percent for non-GSE and GSE loans, respectively, as recently as 2004. If the analysis incorporated all term loans, then average loan characteristics would be affected by changes in the distribution of loan types.

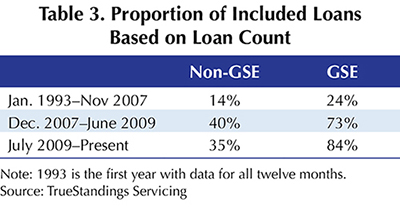
Because credit score, LTV, and DTI are the main factors that determine what interest rate the applicant is offered, the sample includes only TrueStandings Servicing loans that provide information about all three attributes (or LTV and DTI for GSE loans). Table 3 summarizes the proportion of loans included in the sample out of the total number of first-lien, single-family, fixed, 30-year loans for GSE and non-GSE originations. A higher percentage of GSE loans is included in the analysis across all time periods because DTI and LTV values are left undefined at a smaller rate than the credit score component. GSE loans were filtered based on undefined DTI and LTV values, whereas the non-GSE analysis excluded loans with undefined fields in any of the three main components. Even with the stricter selection of data, non-GSE and GSE TrueStandings Servicing loans together account for one-fifth of 2018 Texas HMDA originations. Seeing as TrueStandings Servicing acquires 12 out of the top 20 servicers and all of the Fannie Mae and Freddie Mac contributions, this should constitute a representative sample of the population.
The figure compares the Center’s calculated GSE and non-GSE mortgage rates to Freddie Mac’s U.S. benchmark. The Center’s interest rates are weighted solely on the loan size, while Freddie Mac’s interest rate is the weighted average based on loan size and lender size.
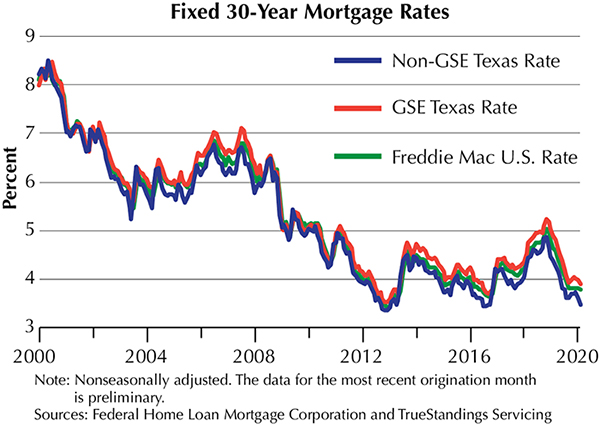
The comovement between the Center’s mortgage rates and the benchmark supports the credibility of the data and methodology. Since 2011, the interest rate for the non-GSE and GSE borrower in Texas has been consistently higher than the national benchmark, corroborating the fact that the typical Texas mortgage loan attributes profile includes loans that would not qualify for Freddie Mac’s survey rate. The differences in interest rates may be due to the credit score component.
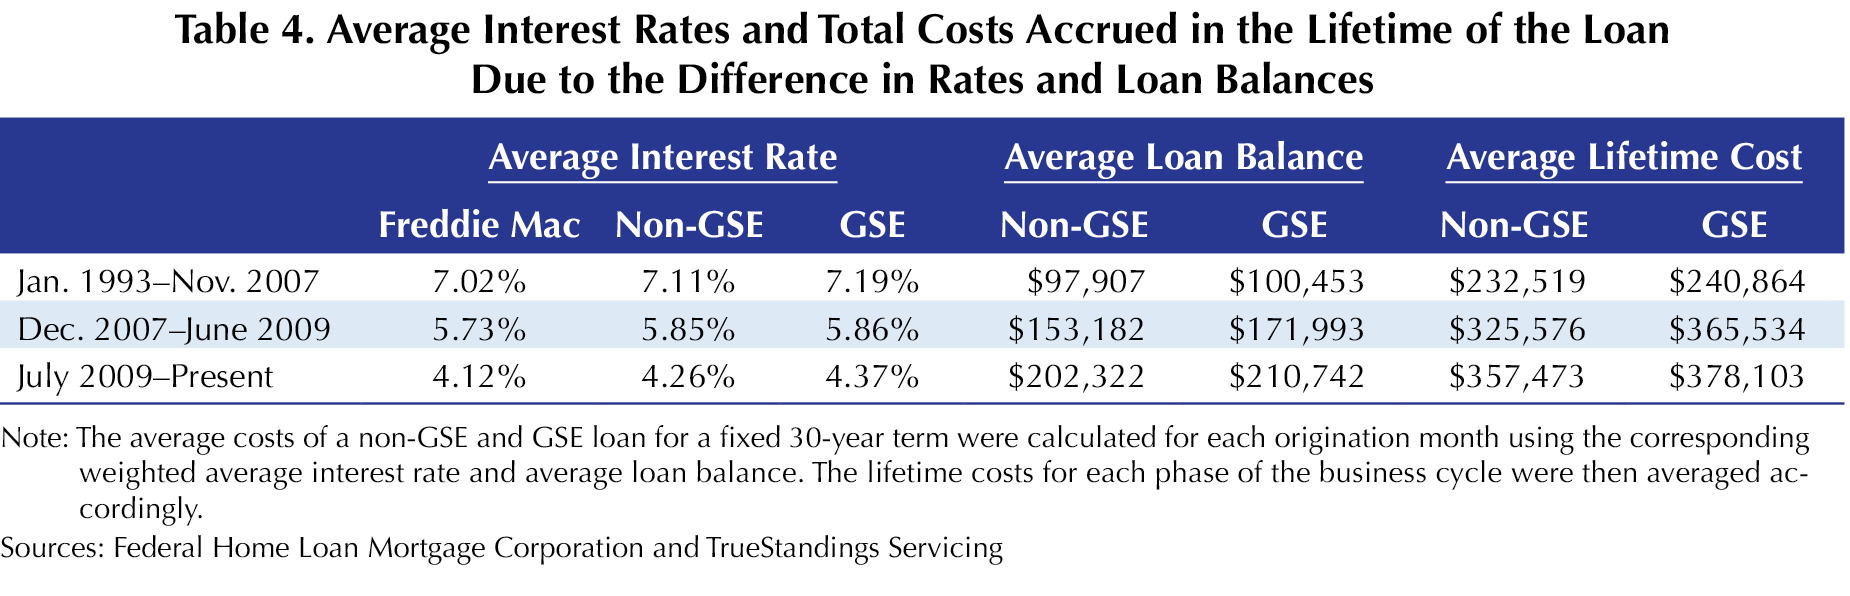
The average interest rates during different phases of the business cycle, as well as the average total impacts of GSE and non-GSE interest rates and loan balances that mortgagees may expect to see, are summarized in Table 4. Prior to the housing crisis, GSE borrowers paid about $8,300 more than non-GSE borrowers over the lifetime of a fixed 30-year mortgage, mainly due to higher interest rates. During the Great Recession, the gap between GSE and non-GSE mortgage costs widened to nearly $40,000 on account of greater average loan principals for the GSE mortgagee than for the non-GSE mortgagee, while average rates were nearly identical. The average difference between GSE and non-GSE loan balances has decreased since the recession. The additional $20,900 a GSE borrower can expect to pay over the lifetime of the loan compared with non-GSE borrowers is mostly attributed to the gap in interest rates.
_______________
Miller ([email protected]) and Silva ([email protected]) are research associates with the Real Estate Center at Texas A&M University.
Sources
“About Mortgage Rates Survey – Freddie Mac." Mortgage Rates Survey – Freddie Mac, www.freddiemac.com/pmms/about-pmms.html.
“Freddie Mac’s Mortgage Rate Survey Explained." Freddie Mac’s Mortgage Rate Survey Explained, 14 June 2019, www.freddiemac.com/research/insight/20190614_mortgage_rate_survey_explained.page.
You might also like

TG Magazine
Check out the latest issue of our flagship publication.